Contrast Analysis with R for factorial designs: A Tutorial

In this post, I want to show how to do contrast analysis with R for factorial designs. We focus on a 2-way between subjects design. A tutorial for factorial within-subjects designs can be found here: https://small-s.science/2019/01/contrast-analysis-with-r-repeated-measures/ . A tutorial for mixed designs (combining within and between subjects factors can be found here: https://small-s.science/2019/04/contrast-analysis-with-r-mixed-design/.

I want to show how we can use R for contrast analysis of an interaction effect in a 2 x 4 between subjects design. The analysis onsiders the effect of students’ seating distance from the teacher and the educational performance of the students: the closer to the teacher the student is seated, the higher the performance. A “theory “explaining the effect is that the effect is mainly caused by the teacher having decreased levels of eye contact with the students sitting farther to the back in the lecture hall.

To test that theory, a experiment was conducted with N = 72 participants attending a lecture. The lecture was given to two independent groups of 36 participants. The first group attended the lecture while the teacher was wearing dark sunglasses, the second group attented the lecture while the teacher was not wearing sunglasses. All participants were randomly assigned to 1 of 4 possible rows, with row 1 being closest to the teacher and row 4 the furthest from the teacher The dependent variable was the score on a 10-item questionnaire about the contents of the lecture. So, we have a 2 by 4 factorial design, with n = 9 participants in each combination of the factor levels. 

Here we focus on obtaining an interaction contrast: we will estimate the extent to which the difference between the mean retention score of the participants on the first row and those on the other rows differs between the conditions with and without sunglasses. 

The interaction contrast with SPSS

I’ve downloaded a dataset from the supplementary materials accompanying Haans (2018) from http://pareonline.net/sup/v23n9.zip (Between2by4data.sav) and I ran the following syntax in SPSS:

UNIANOVA retention BY sunglasses location
 /LMATRIX = "Interaction contrast" 
  sunglasses*location 1 -1/3 -1/3 -1/3 -1 1/3 1/3 1/3 intercept 0
   /DESIGN= sunglasses*location.

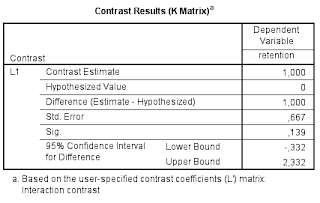
Table 1 is the relevant part of the output.

SPSS Interaction Contrast
Table 1. Spss ouput for the interaction contrast

So, the estimate of the interaction contrasts equals 1.00, 95% CI [-0.332, 2.332]. (See this post for optimizing the sample size to get a more precise estimate than this).

Contrast analysis with R for factorial designs

Let’s see how we can get the same results with R.

library(MASS)
library(foreign)

theData <- read.spss("./Between2by4data.sav")
theData <- as.data.frame(theData)

attach(theData)

# setting contrasts 
contrasts(sunglasses) <- ginv(rbind(c(1, -1)))
contrasts(location)  <- ginv(rbind(c(1, -1/3, -1/3, -1/3),
                                   c(0, 1, -1/2, -1/2), c(0, 0, 1, -1)))

# fitting model

myMod <- lm(retention ~ sunglasses*location)

The code above achieves the following. First the relevant packages are loaded. The MASS package provides the function ginv, which we need to specify custom contrasts and the Foreign package contains the function read.spss, which enables R to read SPSS .sav datafiles.

Getting custom contrast estimates involves calculating the generalized inverse of the contrast matrices for the two factors. Each contrast is specified on the rows of these contrast matrices. For instance, the contrast matrix for the factor location, which has 4 levels, consists of 3 rows and 4 columns. In the above code, the matrix is specified with the function rbind, which basically says that the three contrast weight vectors c(1, -1/3, -1/3, -1/3), c(0, 1, -1/2, -1/2), c(0, 0, 1, -1) form the three rows of the contrast matrix that we use as an argument of the ginv function. (Note that the set of contrasts consists of orthogonal Helmert contrasts).

The last call is our call to the lm-function which estimates the contrasts. Let’s have a look at these estimates.

summary(myMod)
## 
## Call:
## lm(formula = retention ~ sunglasses * location)
## 
## Residuals:
##    Min     1Q Median     3Q    Max 
##     -2     -1      0      1      2 
## 
## Coefficients:
##                       Estimate Std. Error t value Pr(>|t|)    
## (Intercept)             5.3750     0.1443  37.239  < 2e-16 ***
## sunglasses1             1.2500     0.2887   4.330 5.35e-05 ***
## location1               2.1667     0.3333   6.500 1.39e-08 ***
## location2               1.0000     0.3536   2.828  0.00624 ** 
## location3               2.0000     0.4082   4.899 6.88e-06 ***
## sunglasses1:location1   1.0000     0.6667   1.500  0.13853    
## sunglasses1:location2   3.0000     0.7071   4.243 7.26e-05 ***
## sunglasses1:location3   2.0000     0.8165   2.449  0.01705 *  
## ---
## Signif. codes:  0 '***' 0.001 '**' 0.01 '*' 0.05 '.' 0.1 ' ' 1
## 
## Residual standard error: 1.225 on 64 degrees of freedom
## Multiple R-squared:  0.6508, Adjusted R-squared:  0.6126 
## F-statistic: 17.04 on 7 and 64 DF,  p-value: 1.7e-12

For the present purposes, we will consider the estimate of the first interaction contrast, which estimates the difference between the means of the first and  the other rows between the with and without sunglasses conditions. So, we will have to look at the sunglasses1:location1 row of the output.

Unsurprisingly, the estimate of the contrast and its standard error are the same as in the SPSS ouput in Table 1. The estimate equals 1.00 and the standard error equals 0.6667.

Note that the residual degrees of freedom equal 64. This is equal to the product of the number of levels of each factor, 2 and 4, and the number of participants (9) per combination of the levels minus 1: df =  2*4*(9 – 1) = 64. We will use these degrees of freedom to obtain a confidence interval of the estimate.

We will calculate the confidence interval by first extracting the contrast estimate and the standard error,  after which we multiply the standard error by the critical value of t with df = 64 and add the result to and substract it from the contrast estimate:

estimate = myMod$coefficients["sunglasses1:location1"]

se = sqrt(diag(vcov(myMod)))["sunglasses1:location1"]

df = 2*4*(9 - 1)

# confidence interval

estimate + c(-qt(.975, df), qt(.975, df))*se
## [1] -0.3318198  2.3318198


Clearly, we have replicated all the estimation results presented in Table 1.

Reference
Haans, Antal (2018). Contrast Analysis: A Tutorial. Practical AssessmentResearch& Education, 23(9). Available online: http://pareonline.net/getvn.asp?v=23&n=9

Custom contrasts for the one-way repeated measures design using Lmer

Here is some code for doing one-way repeated measures analysis with lme4 and custom contrasts. We will use a repeated measures design with three conditions of the factor Treat and 20 participants. The contrasts are Helmert contrasts, but they differ from the built-in Helmert contrasts in that the sum of the absolute values of the contrasts weights equals 2 for each contrast.
The standard error of each contrast equals the square root of the product of the sum of the squared contrast weight w and the residual variance divided by the number of participants n.

    \[\sigma_{\hat{\psi}} =  \sqrt{\sum{w_i}\sigma^2_e/n}\]

The residual variance equals the within treatment variance times 1 minus the correlation between conditions. (Which equals the within treatment variance minus 1 times the covariance \rho\sigma^2_{within}) .

    \[\sigma^2_e = \sigma^2_{within}(1 - \rho)\]

In the example below, the within treatment variance equals 1 and the covariance 0.5 (so the value of the correlation is .50 as well). The residual variance is therefore equal to .50.

For the first contrasts, the weights are equal to {-1, 1, 0}, so the value of the standard error of the contrasts should be equal to the square root of 2*.50/20 = 0.2236.

library(MASS)
library(lme4)
# setting up treatment and participants factors
nTreat = 3
nPP = 20
Treat <- factor(rep(1:nTreat, each=nPP))
PP <- factor(rep(1:nPP, nTreat))

# generate some random 
# specify means

means = c(0, .20, .50)

# create variance-covariance matrix
# var = 1, cov = .5
Sigma = matrix(rep(.5, 9), 3, 3)
diag(Sigma) <- 1

# generate the data; using empirical = TRUE
# so that variance and covariance are known
# set to FALSE for "real" random data

sco = as.vector(mvrnorm(nPP, means, Sigma, empirical = TRUE))

#setting up custom contrasts for Treatment factor 
myContrasts <- rbind(c(-1, 1, 0), c(-.5, -.5, 1))
contrasts(Treat) <- ginv(myContrasts)

#fit linear mixed effects model: 
myModel <- lmer(sco ~ Treat + (1|PP))

summary(myModel)
## Linear mixed model fit by REML ['lmerMod']
## Formula: sco ~ Treat + (1 | PP)
## 
## REML criterion at convergence: 157.6
## 
## Scaled residuals: 
##     Min      1Q  Median      3Q     Max 
## -2.6676 -0.4869  0.1056  0.6053  1.9529 
## 
## Random effects:
##  Groups   Name        Variance Std.Dev.
##  PP       (Intercept) 0.5      0.7071  
##  Residual             0.5      0.7071  
## Number of obs: 60, groups:  PP, 20
## 
## Fixed effects:
##             Estimate Std. Error t value
## (Intercept)   0.2333     0.1826   1.278
## Treat1        0.2000     0.2236   0.894
## Treat2        0.4000     0.1936   2.066
## 
## Correlation of Fixed Effects:
##        (Intr) Treat1
## Treat1 0.000        
## Treat2 0.000  0.000

Planning for a precise contrast estimate: the mixed model case

In a previous post (here), we saw how we can determine sample size for obtaining, with assurance, a precise interaction contrast estimate. In that post we considered a 2 x 2 factorial design. In this post, I will extend the discussion to the mixed model case. That is, we will consider sample size planning for a precise interaction estimate in case of a design with 2 fixed factors and two random factors: participant and stimulus (item). (A pdf version of this post can be found here: view pdf. )

In order to keep things relatively simple, we will focus on a design where both participants and items are nested under condition. So, each treatment condition has a unique sample of participants and items. We will call this design the both-within-condition design  (see, for instance, Westfall et al. 2014, for detailed descriptions of this design). We will analyse the 2 x 2 factorial design as a single factor design (the factor has a = 4 levels) and formulate an interaction contrast.


Let’s start with p participants and q stimuli. We randomly assign n= p/a participants and m = q/a stimuli to each of the a treatment levels. The ANOVA table for the design is presented in Table 1.

Expected Mean Squares Both Within Condition Design
 
We will use the ANOVA table to illustrate a few concepts that are important to consider when analysing data using mixed modeling. Maybe you remember that in the previous post, we used the ANOVA source table to obtain an expression for the variance of a contrast. In particular, we used the error variance (MSerror) that is also used to form the F-ratio for testing the interaction effect.
 

Obtaining an apropriate error term

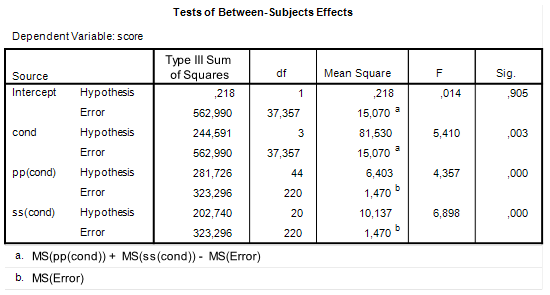
Now, the inclusion of the second random factor (i.e. stimulus in addition to participant) leads, in comparison to the design in the previous post, to a complication. In order to see this, take a look again at the ANOVA table we get when we use SPSS univariate (see Figure 1 and SPSS syntax below). (Important: do not use SPSS GLM Univariate for estimating contrasts in this design; the procedure uses the incorrect standard error; I am using the procedure now just for illustrating a few key concepts).
 
UNIANOVA score BY cond pp ss   
/RANDOM=pp ss   
/METHOD=SSTYPE(3)   
/INTERCEPT=INCLUDE   
/CRITERIA=ALPHA(0.05)   
/DESIGN=cond pp WITHIN cond ss WITHIN cond 
/CONTRAST(cond) = SPECIAL(1, -1, -1, 1).
Figure 1: SPSS GLM ANOVA output
We can see that the effect of condition is not tested against MSError but against an errorterm formed by linearily combining MSpp, MSss, and MSerror. In particular, MSpp and MSss are added and MSerror is subtracted. See footnote a below the source table. It’s a bit hard to explain why that is done, but I’ll have a go at an explanation nonetheless.


Take a look at Table 1 and focus on the Participant row. The expected Mean Square (EMS) associated with Participant is m\sigma^2_p + \sigma^2_e. Now, suppose that due to some freak accident of nature there are no differences in the mean scores (averaged of stimuli) of each participant. In that case, \sigma^2_p = 0. This means that under these circumstances the expected mean square associated with participants is simply an estimate of the error variance with p - a degrees of freedom, because m\sigma^2_p + \sigma^2_e = m*0 + \sigma^2_e = \sigma^2_e, if \sigma^2_p = 0. Of course, the other estimate of the Error variance is MSError and this estimate is based on a(n - 1)(m - 1) degrees of freedom. The logic of the F-test is that under the null-hypothesis, in our case that \sigma^2_p = 0, the ratio of these two estimates of the error variance follows an F-distribution with p - a and a(n - 1)(m - 1) degrees of freedom.

Now focus on the Treatment row in Table 1. The expected mean square associated with Treatment equals nm\theta^2_T + m\sigma^2_p + n\sigma^2_s + \sigma^2_e. If we now suppose that there is no difference between the treatment means, that is \theta^2_T = 0, MSTreatment does not estimate \sigma^2_e, but m\sigma^2_p + n\sigma^2_s + \sigma^2_e. Note that no other source of variance has an expected mean square that is equal to the latter figure. That is, in contrast to our test of the Participant factor, where under the null-hypotheses two Mean Squares estimate the error variance, i.e. MSParticipant and MSError, no mean square is available to form an F-ratio to test the Treatment effect.

But a linear combination of MSParticipant, MSStimulus and MSError, does provide an estimate with expected value m\sigma^2_p + n\sigma^2_s + \sigma^2_e. Namely, the sum of the participant and stimulus mean squares minus mean square error: [m\sigma^2_p + \sigma^2_e] + [m\sigma^2_s + \sigma^2_e] - [\sigma^2_e] = m\sigma^2_p + n\sigma^2_s + \sigma^2_e. It is exactly this linear combination of mean squares that is used in the F-ratio to obtain an error term against which to test the Treatment effect in Figure 1: 6.403 + 10.137 - 1.470 = 15.070. We will also use this figure to obtain the variance (and standard error) of our contrast estimate.

Degrees of freedom

If you take a closer look at Figure 1, in particular the degrees of freedom column, you will notice that the degrees of freedom associated with the error term that is used to test the Treatment effect is a fractional number and not a nice round number that you would expect to get if you only consider the degrees of freedom in Table 1. The cause of this fractional number is that we cannot simply use the degrees of freedom of the mean square used to test the treatment effect, because that mean square does not exist. Indeed, we had to combine three mean squares in order to obtain an estimate of the error term for the Treatment effect. The consequence of this is that we will have to use an approximation of the degrees of freedom associated with that error term.

SPSS (and my precision app) use the Satterthwaite procedure to approximate the degrees of freedom of the error term. That approximation is as follows (notice that the numerator is equal to the linear combination of mean squares used to obtain the error term).

    \[df=\frac{(MSp+MSs-MSe)^{2}}{\frac{MSp^{2}}{df_{p}}+\frac{MSs^{2}}{df_{s}}+\frac{MSe^{2}}{df_{e}}}.\]

Thus, using the results in Figure 1.

MSp = 6.403
MSs = 10.137
MSe = 1.470
dfp = 44
dfs = 20
dfe = 220
df = (MSp + MSs - MSe)^2 / (MSp^2/dfp + MSs^2/dfs + MSe^2/dfe)
df
## [1] 37.35559

The margin of error of a contrast estimate

Now that we have obtained the error variance of a treatment effect by using a linear combination of mean squares and a Satterthwaite approximation of the degrees of freedom we are able to figure out the margin of error (MOE) of our contrast estimate. Just as in the simple between subjects design we discussed previously we obtain MOE by multiplying the standard error of the estimate with a critical value of t. The critical value of t is the .975 quantile of the central t-distribution with the Satterthwaite approximated degrees of freedom (if you are looking for something other than a 95% confidence interval, you will have to use another critical value, of course). The following code gives the critical value of t for a 95% confidence interval (change the value of C if you want something other than a 95% interval).

C = .95
alpha = 1 - C
critT = qt(1 - alpha/2, df)
critT
## [1] 2.025542

The standard error of the contrast estimate \hat{\psi} can be obtained as follows.

    \[\hat{\sigma}_{\hat{\psi}}=\sqrt{\sum c_{i}^{2}\hat{\sigma}_{\bar{X},Rel}^{2}},\]

where I have used the symbol \sigma^2_{\bar{X},Rel} to refer to the relative error variance of the treatment mean (which in this design is equal to the absolute error variance, but that’s another story), and c_i refers to the contrast weight of treatment mean i. The relative error variance of the treatment mean is obtained by dividing the error variance that is used to test the treatment effect by the total number of observations in each treament, nm. Thus, using the results in Figure 1.

    \[\hat{\sigma}_{\bar{X},Rel}^{2}=\frac{MS_{p}+MS_{s}-MS_{e}}{nm}=\frac{15.07}{72}=0.2093.\]

If we want to estimate an interaction contrast for the 2 x 2 design, we may, for example, specify contrasts weights {1, -1, -1, 1}. Let’s use the results in Figure 1 to calculate what MOE is for this particular contrast.

#sample sizes per treatment
n = 12
m = 6

#obtained mean squares (see Figure 1): 
MSp = 6.403
MSs = 10.137
MSe = 1.470

#Relative error variance: 
VarT = (MSp + MSs - MSe) / (n*m)

#contrast weights: 
weights = c(1, -1, -1, 1)

#standard error of contrast estimate
SEcontrast = sqrt(sum(weights^2)*VarT)

#Satterthwaite degrees of freedom: 
dfp = 44
dfs = 20
dfe = 220
df = (MSp + MSs - MSe)^2 / (MSp^2/dfp + MSs^2/dfs + MSe^2/dfe)

#critical T 
critT = qt(.975, df)

#Margin of Error 
MOE = critT * SEcontrast

SEcontrast; MOE
## [1] 0.9149985
## [1] 1.853368

SPSS GLM Univariate uses the wrong standard error for a mixed model contrast estimate

Even though SPSS GLM Univariate allows you to specify a mixed model design and tests the treatment effect with a linear combination of mean squares, the procedure does not use the correct error variance if you want to estimate the value of a contrast (using the CONTRAST subcommand), it uses MSError instead. In our example, then, SPSS uses an error variance that is an order of magnitude smaller than the correct error variance: 1.47, with 220 degrees of freedom and not 15.07, with 37.357 (see Figure 1). The consequence of this is, of course, that the 95% CI is much narrower than it should be.

Running the syntax above Figure 1 gives the output in Figure 2. The results can be reproduced as follows. The standard error of the contrast is the result of SE = \sqrt{\sum{c_i^2}\frac{MSe}{nm}} = \sqrt{4*1.47/72} = 0.2858, the critical value of t is the .975 quantile of the central t distribution with df = 220, which equals 1.9708. The value of MOE is therefore MOE = 0.5633. With a contrast estimate of -0.587, the 95% CI equals -0.587 \pm 0.5633 = [-1.1503, -0.0237]. In comparison, using the correct value of MOE gives us [−2.4404, 1.2664].

Figure 2: SPSS GLM Univariate Contrasts Output
Thus, even though SPSS GLM Univariate gives us the ingredients to work with, i.e. an estimate of the error variance and approximate degrees of freedom, it should not be used for obtaining contrast estimates if you have a mixed model. SPSS Mixed does a much better job and the MIXED output also contains other useful data we can use for sample size planning. (In practice, I use the linear mixed effects modeling package LME4) and not so much SPSS). Have a quick look at Figure 3 for the contrast estimate obtained with the mixed procedure. (Note how the numbers are essentially the same as the ones we obtained when using the ANOVA source table of SPSS GLM Univariate (Figure 1)).
MIXED score BY cond   
/CRITERIA=CIN(95) MXITER(100) MXSTEP(10) SCORING(1) 
SINGULAR(0.000000000001) HCONVERGE(0, ABSOLUTE) 
LCONVERGE(0, ABSOLUTE) PCONVERGE(0.000001, ABSOLUTE)   
/FIXED= cond | SSTYPE(3)   
/METHOD=REML  
/TEST= 'interaction' cond 1 -1 -1 1   
/RANDOM=INTERCEPT | SUBJECT(pp) COVTYPE(VC)  
/RANDOM=INTERCEPT | SUBJECT(ss) COVTYPE(VC).
Figure 3: Contrast Estimate SPSS Mixed


Planning for precision

Even though the result in Figure 3 is hard to interpret without substantive detail (the data are made up) it is clear that the precision of the estimate is, well, suboptimal. As an indication: the estimated within treatment standard deviaion is about 1.74, so the estimated difference between differences (interaction) is close to a value of Cohen’s d of -.30, approximate 95% CI [-1.40, 0.73], which according to the rules of thumb is a medium negative effect, but consistent with anytihing from a huge negative effect to a large positive effect in the population, as the approximate CI shows. (I have divided the point estimate and the confidence interval in Figure 2 by 1.74, to obtain Cohen’s d and an approximate confidence interval). Clearly, then, our precision can be optimized.

Suppose that you are very fond of the both-within-condition design (BwC-design) and you plan to use it again in a replication study, You could of courseopt for a design with better expected precision, but based on the data and estimates at hand, that involves a lot of assumptions, but I will show you how you can do it in one of the next posts. If you plan for precision using the BwC-design, you need the following ingrediënts.

1. A figure for your target MOE. Let’s set target MOE to .40.

2. A specification of the percentage of assurance. Let’s say we want 80% assurance that target MOE will not exceed .40.

3. Estimates (or guesstimates) of the person variance \sigma^2_p, the stimulus variance \sigma^2_s, and the error variance \sigma^2_e. We will have a look in the next section.

4. Functions for calculating the relative error variance, degrees of freedom, MOE and determining the required sample sizes for Participants and Stimuli. These are all present in the Precision App, so I will use the application, but I will show how the results of the sample sizes relate to the information above.

Obtaining estimates of the variance components

We need to specify the values of three variance components. These variance components can be estimated on the basis of the mean squares and sample sizes obtained with SPSS GLM Univariate, we can use SPSS MIXED to obtain direct estimates or any other way to estimate variance components, such as GLM VARCOMPS (which has several estimation procedures). I like to use SPSS MIXED or LME4. and not a dedicated program for variance components, because most of the times the main purpose of the analysis I am doing is obtaining contrast estimate or F-tests, so most of the times variance components estimates are a handy by-product of my main analysis. For demonstrative purposes, I will show how it can be done with the GLM univariate output and I will show how the results match those of SPSS MIXED.

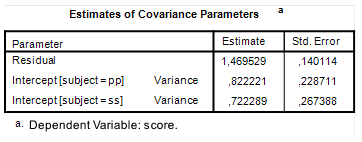
Take a look at Figure 1. The estimate of \sigma^2_e is simply MS(Error) = 1.47. For obtaining an estimate for the variance component associated with participants, we set the obtained mean square equal to the expected mean square (see Table 1). Thus, 6.403 = m\sigma^2_p + \sigma^2_e. Rearranging and using 1.47 as an estimate for \sigma^2_e leads to \sigma^2_p = (6.403 - \sigma^2_e) / m = (6.403 - 1.47) / 6 = 0.8222. Likewise, the estimate for \sigma^2_s = (10.137 - 1.47) / 12 = .7223. Thus, our estimates are \hat{\sigma}^2_e = 1.47, \hat{\sigma}^2_p = 0.8222, and \hat{\sigma}^2_s = 0.7223.

In order to obtain direct estimates you can use SPSS Mixed (or GLM Varcomps, or whatever you like). If you run the SPSS syntax in Figure 3, you will find estimates of the variance components under the heading Covariance Parameters in your SPSS output. See Figure 4. Note that the standard errors are pretty large, so the point estimates are not very precise. But since it is the only information we have, we will consider the point estimates to be the best we have.

Figure 4: Variance components estimates


Getting sample sizes with the Precision application

 
Let’s use the Precision app (https://gmulder.shinyapps.io/precision/) for sample size planning. Set the design to Stimulus and Participant within condition, the number of conditions to 4 and in the options for contrast 3 fill in the weights {1, -1, -1, 1} (Note: it is not necessary to fill it in in contrast 3).
 
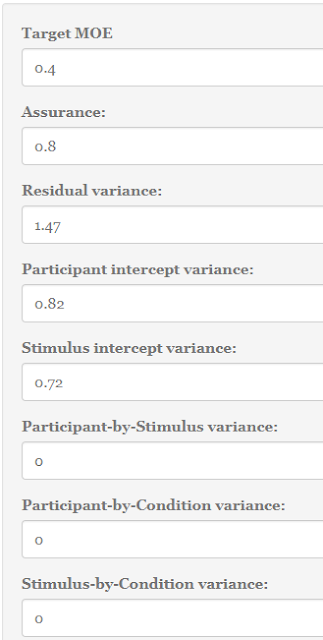
For target MOE fill in 0.4, for assurance the value .80 and the values 1.47, 0.82, and 0.72 for, respectively, Residual variance, Participant intercept variance and Stimulus intercept variance. Fill in the value 0 for all the other variances. See Figure 5.
 
 
Figure 5: Setting values in the Precision App.
 
Press the button “Get Sample Sizes”. The calculations take a while, so make yourself some coffee (or anything else you like) and when you return the screen should show something like Figure 6a.
Figure 6a: Output for planning target MOE = 0.40
 
Figure 6b: Outpur for planning target MOE = 0.50
 
By the way, if you wonder why you can simply set the three interaction variance components to zero, then it may be nice to know that the variance components estimates obtained from the both-within-condition design already include them. For example, the estimate of the resiidual variance obtained with the both-within-condition design is actually the sum of the residual variance component and the interaction conponent of participant and stimulus. These latter components can only be separated in a fully-crossed-design where all participants respond to all stimuli in all conditions. Thus, if we use the symbol \sigma^2_{e, bwc}, to refer to the residual variance in the BwC-design, we can say \sigma^2_{e, bwc} = \sigma^2_{ps} + \sigma^2_e. Normally, the precision app sums these two components to get a value for the residual variance in the BwC-design, and you will obviously get the same result if you specify the residual variance as the sum and the participant-by-stimulus variance as 0. Likewise, \sigma^2_{p, bwc} = \sigma^2_p + \sigma^2_{cp}, and \sigma^2_{s, bwc} = \sigma^2_s + \sigma^2_{cs}, where \sigma^2_{cp} and \sigma^2_{cs} are the variances associated with the interaction of treatment and participant and treatment and stimulus, respectively.
 
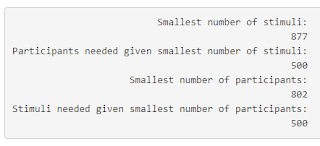
If you look at the sample sizes in Figure 6a, you may notice that the numbers look odd. For example, the app says that the smallest number of stimuli is 877 but it also says that you only need 500 stimuli if you select 802 participants. And something like that happens to the participants as well. The output says that the smaller number of participants is 802, but it also suggest using 500 of them if you use 877 stimuli, which is clearly smaller than 802. To me this seems a little inconsistent. But I think I figured out what’s going on. The reason for these inconsistencies is that the application minimizes the sample sizes, but with a maximum of 500 for the other sample sizes. So, the smallest number of stimuli is 877 given that the maximum number of participants is 500. In other words, a smaller sample size is possible, but then we have to increase the maximum number of participants. In other words, in order to have 80% assurance to obtain a target MOE of no more than .40, we need at least 500 stimuli or at least 500 participants. If you look at Figure 6b, you will not notice these inconsistencies. The difference between the left and right sample sizes is that sizes on the right are based on a target MOE of .50 instead of .40.
 
According to Figure 6a, we can obtain our target if we use 802 participants and 500 stimuli. Since we are planning for an experiment with 4 treatment conditions, these total sample sizes need to be divided by 4 to get the sample sizes per treatment conditions. Thus, n = 804/4 = 201 participants, and m = 500 / 4 = 125 stimuli per treatment condition (I’ve increased the participants sample size to make it divisible by 4). For many experiments these numbers are impractically large, of course, so in this case you would probably either consider an alternative design or else you have to live with the message that you may not get the precision you want or need.
 

Checking the sample size suggestions using what we know

If we fill in the sample sizes (802 participants and 500 stimuli) in the Precision app we get the results presented in Figure 7 for the interaction contrast (contrast 3). Expected MOE equals 0.3927, and there is 80% assurance that MOE will not exceed 0.4065. Note, again, that the assurance MOE is somewhat larger than target MOE, because a sample of 804 participants requires a sample of more than 500 stimuli to get the target MOE with 80% assurance and 500 stimuli is the maximum number of stimuli the app considers when minimizing the number of participants.
 
Figure 7: Expected and Assurance MOE for the interaction contrast (contrast 3) using 804 participants and 500 stimuli
Let’s see if we can reconstruct the figures using what we know from previous sections. First the relative error variance of the treatment mean. That relative error variance is (m\sigma^2_p + n\sigma^2_s + \sigma^2_e)/ nm = 0.0099.
 
The degrees of freedom can be calculated by first filling in the expected mean squares and the degrees of freedom presented in Table 1: MS_p = 125*.82 + 1.47 = 103.96, df_p = 800, MS_s = 201*.72 + 1.47 = 146.19, df_s = 496, MS_e = 1.47, and df_e = 4*(201 - 1)*(125 - 1) = 99200. The Satterthwaite degrees of freedom are (MS_p + MS_s - MS_e)^2 / (MS_p^2/df_p + MS_s^2/df_s + MS_e^2/df_e) = 1092.66. The standard error of the contrast equals \sqrt{4*.0099} = 0.1990. The critical value for t equals 1.9621. Expected MOE is, therefore, 0.3905 (the tiny difference with the results from the app is due to rounding errors).
 
For the calculation of assurance MOE we need to take the sampling distribution of the relative error variance of the treatment mean into account. The app uses the (scaled) \chi^2-distribution. That is, we assume with assurance \gamma, that the \gamma quantile of the sampling distribution of the relative error error variance is \sigma^2_{\bar{X}, rel}*\chi^2_{\gamma, df}/df. Now, the degrees of freedom are 1092.66, the assurance \gamma = .80, and the .80 quantile of \chi^2 with 1092.66 degrees of freedom equals 1131.7966. Since the relative error variance equals 0.0099, the .80 quantile of the error variance equals 0.0099*1131.7966/1092.66 = 0.0103. And this means that assurance MOE equals 1.9621*\sqrt{4*0.0103} = 0.3982. Again, the difference with the results from the Precision App are due to rounding error.

Planning for Precision: A confidence interval for the contrast estimate

In a previous post, which can be found here, I described how the relative error variance of a treatment mean can be obtained by combining variance components.  I concluded that post by mentioning how this relative error variance for the treatment mean can be used to obtain the variance of a contrast estimate. In this post, I will discuss a little more how this latter variance can be used to obtain a confidence interval for the contrast estimate, but we take a few steps back and consider a relatively simple study.

The plan of this post is as follows. We will have a look at the analysis of a factorial design and focus on estimating an interaction effect. We will consider both the NHST approach and an estimation approach. We will use both ‘hand calculations’ and SPSS.

An important didactic aspect of this post is to show the connection between the ANOVA source table and estimates of the standard error of a contrast estimate. Understanding that connections helps in understanding one of my planned posts on how obtaining these estimates work in the case of mixed model ANOVA.  See the final section of this post.


The data we will be analyzing are made up. They were specifically designed for an exam in one of the undergraduate courses I teach. The story behind the data is as follows.

Description of the study

A researcher investigates the extent to which the presence of seductive details in a text influences text comprehension and motivation to read the text. Seductive details are pieces of information in a text that are included to make the text more interesting (for instance by supplying fun-facts about the topic of the text) in order to increase the motivation of the reader to read on in the text. These details are not part of the main points in the text. The motivation to read on may lead to increased understanding of the main points in the text. However, readers with much prior knowledge about the text topic may not profit as much as readers with little prior knowledge with respect to their understanding of the text, simply because their prior knowledge enables them to comprehend the text to an acceptable degree even without the presence of seductive details.

The experiment has two independent factors, the readers’ prior knowledge (1 = Little,  2 =  Much) and the presence of seductive details (1 = Absent, 2 = Present) and two dependent variables, Text comprehension and Motivation.  The experiment has a between participants design (i.e. participant nested within condition).

The research question is how much the effect of seductive details differs between readers with much and readers with little prior knowledge. This means that we are interested in estimating the interaction effect of presence of seductive details and prior knowledge on text comprehension.

The NHST approach

In order to appreciate the different analytical focus between traditional NHST (as practiced) and an estimation approach, we will first take a look at the NHST approach to the analysis. It may be expected that researchers using that approach perform an ANOVA ritual as a means of answering the research question. Their focus will be on the statistical significance of the interaction effect, and if that interaction is significant the effect of seductive details will be investigated separately for participants with little and participants with much prior knowledge. The latter analysis focuses on whether these simple effects are significant or not. If the interaction effect is not significant, it will be concluded that there is no interaction effect. Of course, besides the interaction effect, the researcher performing the ANOVA ritual will also report the significance of the main effects and will conclude that main effects exist or not exist depending on whether they are significant or not. The more sophisticated version of NHST will also include an effect size estimate (if the corresponding significance test is significant) that is interpreted using rules of thumb. 
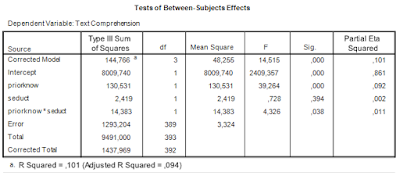
The two way ANOVA output (including partial eta squared) is as follows. 
indepedent factorial anova
Table 1. Output of traditional two-way ANOVA

The results of the analysis will probably be reported as follows.

There was a significant main effect of prior knowledge (F(1, 393) = 39.26, p < .001, partial η2 = .09). Participants with much prior knowledge had a higher mean text comprehension score than the participants with little prior knowledge.  There was no effect of the presence of seductive details (F < 1).  The interaction effect was significant (F(1, 393) = 4.33, p < .05, partial η= .01).

Because of the significant interaction effect, simple effects analyses  were performed to further investigate the interaction. These results show a significant effect of the presence of seductive details for the participants with little knowledge (p < .05), with a higher mean score in the condition with seductive details, but for the participants with much prior knowledge no effect of seductive details was found (p = .38), which explains the interaction. (Note: with a Bonferroni correction for the two simple effects analyses the p-values are p = .08 and p = .74; this will be interpreted as that neither readers with little knowledge nor with much knowledge benefit from the presence of seductive details).

The conclusion from the traditional analysis is that the effect of seductive details differs between readers with little and readers with much prior knowledge. The presence of seductive details only has an effect on the comprehension scores of readers with little prior knowledge of the text topic, in the presence of seductive details text comprehension is higher than in the absence of seductive details. Readers with much prior knowledge do not benefit from the presence of seductive details in a text.

Comment on the NHST analysis

The first thing to note is that the NHST conclusion does not really answer the research question. Whereas the research question ask how much the effects differ, the answer to the research question is that a difference exists. This answer is further specified as that there exists an effect in the little knowledge group, but that there is no effect in the much knowledge group. 
The second thing to note is that although there is a simple research questions, the report of the results includes five significance tests, while none of them actually address the research question. (Remember it is an how-much question and not a whether-question, the significance tests do not give useful information about the how-much question). 
The third thing to notice is that although effect sizes estimates are included (for the significant effects only) they are not interpreted while drawing conclusions. Sometimes you will encounter such interpretations, but usually they have no impact on the answer to the research question. That is, the researcher may include in the report that there is a small interaction effect (using rules-of-thumb for the interpretation of partial eta-squared; .01 = small; .06 = medium, .14 = large), but the smallness of the interaction effect does not play a role in the conclusion (which simply reformulates the (non)significance of the results without mentioning numbers; i.e. that the effect exists (or was found) in one group but not in the other). 

As an aside, the null-hypothesis test for the effect of prior knowledge i.e. that the mean comprehension score of readers with little knowledge are equal to the mean comprehension score of readers with much prior knowledge about the text topic seems to me an excellent example of a null-hypothesis that is so implausible that rejecting it is not really informative. Even if used as some sort of manipulation check the real question is the extent to which the groups differ and not whether the difference is exactly zero. That is to say, not every non-zero difference is as reassuring as every other non-zero difference: there should be an amount of difference between the groups below which the group performances can be considered to be practically the same. If a significance tests is used at all, the null-hypothesis should specify that minimum amount of difference.

Estimating the interaction effect

We will now work towards estimating the interaction effect. We will do that in a number of steps. First, we will estimate the value of the contrasts on the basis of the estimated marginal means provided by the two-way ANOVA and show how the confidence interval of that estimate can be obtained. Second, we will use SPSS to obtain the contrast estimate. 
Table 2 contains the descriptives and samples sizes for the groups and the estimated marginal means are presented in Table 3. 
Table 2. Descriptive Statistics
Table 3. Estimated Marginal Means

Let’s spend a little time exploring the contents of Table 3. The estimated means speak for themselves, hopefully. These are simply estimates of the population means.

The standard errors following the means are used to calculate confidence intervals for the population means. The standard error is based on an estimate of the common population variance (the ANOVA model assumes homogeneity of variance and normally distributed residuals). That estimate of the common variance can be found in Table 1: it is the Mean Square Error. Its estimated value is 3.32, based on 389 degrees of freedom.

The standard errors of the means in Table 3 are simply the square root of the Mean Square Error dvided by the sample size. E.g. the standard error of the mean text comprehension in the group with little knowledge and seductive details absent equals √(3.32/94) = .1879.

The Margin of Error needed to obtain the confidence interval is the critical t-value with 389 degrees of freedom (the df of the estimate of Mean Square Error) multiplied by the standard error of the mean. E.g. the MOE of the first mean is t.975(389)*.1879 = 1.966*.1879 = 0.3694.

The 95%-confidence interval for the first mean is therefore 3.67 +/- 0.3694 = [3.30, 4.04].

Contrast estimate

We want to know the extent to which the effect of seductive details differs between readers with little and much prior knowledge. This means that we want to know the difference between the differences. Thus, the difference between the means of the Present (P) and Absent (A) of readers with Much (M) knowledge is subtracted from the difference between the means of the  readers with Little (L) knowledge: (ML+P – ML+A) – (MM+P – MM+A) = ML+P – ML+A – MM+P + MM+A = 4.210 – 3.670 – 4.980 + 5.206 =  0.766.

Our point estimate of the difference between the effect of seductive details for little knowledge readers and for much knowledge is  that the effect is 0.77 points larger in the group with little knowledge.

For the interval estimate we need the estimated standard error of the contrast estimate and a critical value for the central t-statistic. To begin with the latter: the degrees of freedom are the degrees of freedom used to estimate Mean Square Error (df = 389; see Table 1).

The standard error of the contrasts estimate can be obtained by using the variance sum law. That is,  the variance of the sum of two variables is the sum of their variances plus twice the covariance. And the variance of the difference between two variables is the sum of the variances minus twice the covariance. In the independent design, all the covariances between the means are zero, so the variance of the interaction contrast is simply the sum of the variances over the means. The standard error is the square root of this figure. Thus, var(interaction contrast) = 0.1882 + 0.1822 + 0.1852 + 0.1812 = 0.1354, and the standard error of the contrast is the square root of  0.1354 = .3680.

Note that the we have squared the standard errors of the mean. These squared standard error are the same as the relative error variances of the means. (Actually, in a participant nested under treatment condition (a between-subject design) the relative error variance of the mean equals the absolute error variance). More information about the error variance of the mean can be found here: https://the-small-s-scientist.blogspot.nl/2017/05/PFP-variance-components.html.

The Margin of Error of the contrast estimate is therefore t.975(389)*.3680 = 1.966*.3680 = 0.7235. The 95% confidence interval for the contrast estimate is [0.04, 1.49].

Thus, the answer to the research question is that the estimated difference in effect of seductive details between readers with little prior knowledge and readers with much prior knowledge about the text topic equals .77, 95% CI [.04, 1.49].  The 95% confidence interval shows that the estimate is very imprecise, since the limits of the interval are .04, which suggests that the effect of seductive details is essentially similar for the different groups of readers, and 1.49, which shows that the effect of seductive details may be much larger for little knowledge readers than for much knowledge readers.

Analysis with SPSS

I think it is easiest to obtain the contrast estimate by modeling the data with one-way ANOVA by including a factor I’ve called ‘independent’. (Note: In this simple case, the parameter estimates output of the independent factorial ANOVA also gives the interaction contrast (including the 95% confidence interval), so there is no actual need to specify contrasts, but I like to have the flexibility of being able to get an estimate that directly expresses what I want to know). This factor has 4 levels: one for each of the combinations of the factors prior knowledge and presence of seductive details: Little-Absent (LA), Little-Present (LP),  Much-Absent (MA), and Much-Present (MP).

The interaction we’re after is the difference between the mean difference between Present and Absent for participants with little knowledge (MLP – MLA) and the mean difference between Present and Absent in the much knowledge group (MMP – MMA).  Thus, the estimate of the interaction (difference between differences) is (MLP – MLA) – (MMP – MMA) = MLP – MLA – MMP + MMA. This can be rewritten as 1*MLP + -1*MLA + -1*MMP + 1*MMA).

The 1’s and -1’s are of course the contrast weights we have to specify in SPSS in order to get the estimate we want. We will have to make sure that the weights correspond to the way in which the order of the means is represented internally in SPSS. That order is LA, LP, MA, MP.  Thus, the contrast weights need to be specified in that order to get the estimate to express what we want in terms of the difference between differences. See the second line in the following SPSS-syntax.

UNIANOVA comprehension BY independent
  /CONTRAST(independent)=SPECIAL ( -1 1 1 -1)
  /METHOD=SSTYPE(3)
  /INTERCEPT=INCLUDE
  /EMMEANS=TABLES(independent)
  /PRINT=DESCRIPTIVE
  /CRITERIA=ALPHA(.05)
  /DESIGN=independent.

The relevant output is presented in Table 4. Note that the results are the same as the ‘hand calculations’ described above (I find this very satisfying).

Table 4. Interaction contrast estimate

Comment on the analysis 

First note that the answer to the research question has been obtained with a single analysis. The analysis gives us a point estimate of the difference between the differences and a 95% confidence interval. The analysis is to the point to the extent that it gives the quantitative information we seek. 
However, although the estimate of the difference between the differences is all the quantitative information we need to answer the how-much-research question, the estimate itself obscures the pattern in the results, in the sense that the estimate itself does not tell us what may be important for theoretical or practical reasons, namely the direction of the effect.  That is, a positive interaction contrast may indicate the difference between an estimated positive effect for one group and an estimated negative effect  in the other group (which is actually the situation in the present example: 0.54 – (-0.23) = 0.77) in the other group). 
Of course, we could argue that if you want to know the extent to which the size and direction differ between the groups, then that should be reflected in your research question, for instance, by asking about and estimating the simple effects themselves in stead of focusing on the size of the difference alone, as we have done here. 

On the other hand, we could argue that no result  of a statistical analysis should be interpreted in isolation. Thus, there is no problem with interpreting the estimate of 0.77 while referring to the simple effects: the estimated difference between the effects is .77,  95% CI [.04, 1.49], reflecting the difference between an estimated effect of 0.54 in the little knowledge group and an estimated negative effect of -0.23 for much knowledge readers.

But, if the research question is how large is the effect of seductive details for little knowledge readers and high knowledge readers and how much do the effect differ, than that would call for three point estimates and interval estimates. Like: the estimated effect for the little knowledge group equals 0.54. 95% CI [0.03, 1.06], whereas the estimated effect for the much knowledge groups is negative -0.23, 95% CI [-0.73, 0.28]. The difference in effect is therefore 0.77,  95% CI [.04, 1.49].

In all cases, of course, the intervals are so wide that no firm conclusions can be drawn. Consistent with the point estimates are negligibly small positive effects to large positive effects of seductive details for the little knowledge group,  small positive effects to negative effects of seductive details for the much knowledge group and an interaction effect that ranges from negligibly small to very large. In other words, the picture is not at all clear.  (Interpretations of the effect sizes are based on rules of thumb for Cohen’s d. A (biased) estimate of Cohen’s d can be obtained by dividing the point estimate by the square root of Mean Square Error. An approximate confidence interval can be obtained by dividing the end-points of the non-standardized confidence intervals by the square root of Mean Square Error). Of course, we have to keep in mind that 5% of the 95% confidence intervals do not contain the true value of the parameter or contrast we are estimating.

Compare this to the firm (but unwarranted) NHST conclusion that there is a positive effect of seductive details for little knowledge readers (we don’t know whether there is a positive effect, because we can make a type I error if we reject the null) and no effect for much knowledge readers. (Yes, I know that the NHST thought-police forbids interpreting non-significant results as “no effect”, but we are talking about NHST as practiced and empirical research shows that researchers interpret non-significance as no effect).

In any case, the wide confidence intervals show that we could do some work for a replication study in terms of optimizing the precision of our estimates. In a next post, I will show you how we can use our estimate of precision for planning that replication study.

Summary of the procedure

In (one of the next) posts, I will show that in the case of mixed models ANOVA’s we frequently need to estimate the degrees of freedom in order to be able to obtain MOE for a contrast. But the basic logic remains the same as what we have done in estimating the confidence interval for the interaction contrast.  Please keep in mind the following. 
Looking at the ANOVA source table and the traditional ANOVA approach we notice that the interaction effect is tested against Mean Square Error: the F-ratio we use to test the null-hypothesis that both Mean Squares (the interaction MS an Mean Square Error) estimate the common error variance. The F-ratio is formed by dividing the Mean Square associated with the interaction by Mean Square Error.  The probability distribution of that ratio is an F-distribution with 1 (numerator) and 389 (denominator) degrees of freedom. 
Mean Square Error is also used to obtain the estimated standard error for the interaction contrast estimate. In the calculation of MOE, the critical value of t was determined on the basis of the degrees of freedom of Mean Square Error. 
This is the case in general: the standard error of a contrast is based on the Mean Square Error that is also used to test the corresponding Effect (main or interaction) in an F-test. In a simple two-way ANOVA the same Mean Square Error is used to test all the effects (main an interaction), but that is not generally the case for more complex designs. Also, the degrees of freedom used to obtain a critical t-value for the calculation of MOE are the degrees of freedom of the Mean Square Error used to test an effect. 
In the case of a mixed model ANOVA, it is often the case that there is no Mean Square Error available  to directly test an effect. The consequence of this is that we work with linear combinations of Mean Squares to obtain a suitable Mean Square Error for an effect and that we need to estimate the degrees of freedom. But the general logic is the same: the Mean Square Error that is obtained by a linear combination of Mean Squares is also used to obtain the standard error for the contrast estimate and the estimated degrees of freedom are the degrees of freedom used to obtain a critical value for t in the calculation of the Margin of Error. 
I will try to write about all of that soon. 

Planning for Precision: Introduction to variance components

Both theory underlying the Precision application and the use of the app in practice rely for a large part on specifying variance components. In this post, I will give you some more details about what these components are, and how they relate to the analysis of variance model underlying the app.

What is variance?

Let’s start with a relatively simple conceptual explanation of variance. The key ideas are expected value and error.  Suppose you randomly select a single score from a population of possible values. Let’s suppose furthermore that the population of values can be described with a normal distribution. There is actually no need to suppose a normal distribution, but it makes the explanation relatively easy to follow.

As you probably know, the normal distribution is centered around its mean value, which is (equal to) the parameter μ. We call this parameter the population mean.

Now, we select a single random value from the population. Let’s call this value X.  Because we know something about the probability distribution of the population values, we are also in the position to specify an expected value for the score X. Let’s use the symbol E(X) for this expected value. The value of E(X) proves (and can be proven) to be equal to the parameter μ. (Conceptually, the expectation of a variable can be considered as its long run average).

Of course, the actual value obtained will in general not be equal to the expected value, at least not if we sample from continuous distributions like the normal distribution. Let’s call the difference between the value X and it’s expectation E(X) = μ. an error, deviation or residual: e = X – E(X) = X –  μ.

We would like to have some indication of the extent to which X differs from its expectation, especially when E(X) is estimated on the basis of  a statistical model.  Thus, we would like to have something like E(X – E(X)) = E(X –  μ). The variance gives us such an indication, but does so in squared units, because working with the expected error itself always leads to the value 0  E(X –  μ) = E(X) – E( μ) =  μ –  μ = 0. (This simply says that on average the error is zero; the standard explanation is that negative and positive errors cancel out in the long run).

The variance is the expected squared deviation (mean squared error) between X and its expectation: E((X – E(X))2) = E(X –  μ)2), and the symbol for the population value is σ2.

Some examples of variances (remember we are talking conceptually here):
– the variance of the mean, is the expected squared deviation between a sample mean and its expectation the population mean.
– the variance of the difference between two means:  the expected squared deviation between the sample difference and the population difference between two means.
– the variance of a contrast: the expected squared deviation between the sample value of the contrast and the population value of the contrast.

It’s really not that complicated, I believe.

Note: in the calculation of t-tests (and the like), or in obtaining confidence intervals, we usually work with the square root of the variance: the root mean squared error (RMSE), also known as the standard deviation (mostly used when talking about individual scores) or standard error (when talking about estimating parameter values such as the population mean or the differences between population means).

What are variance components?  

In order to appreciate what the concept of a variance component entails, imagine an experiment with nc treatment conditions in which np participants respond to ni items (or stimuli) in all conditions. This is called a fully-crossed experimental design.

Now consider the variable Xcpi. a random score in condition t, of participant p responding to item i. The variance of this variable is σ2(Xcpi) = E((Xcpi –  μ)2). But note that just as the single score is influenced by e.g. the actual treatment condition, the particular person or item, so too can this variance be decomposed into components reflecting the influence of these factors. Crucially, the total variance  σ2(Xcpi) can be considered as the sum of independent variance components, each reflecting the influence of some factor or interaction of factors.

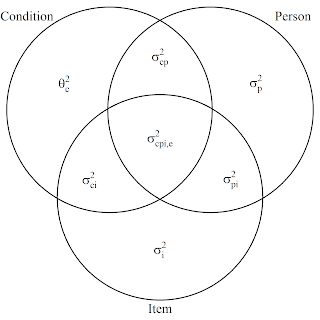
The following figure represents the components of the total variance in the fully crossed design (as you can see the participants are now promoted to actual persons…)

The symbols used in this figure represent the following. Θ2 is used to indicate that a component is considered to be a so-called fixed variance component (the details of which are beyond the scope of this post), and the symbol σ2 is used to indicate components associated with random effects. (The ANOVA model contains a mixture of fixed and random effects, that’s why we call such models mixed effects models or mixed model ANOVAs). Components with a single subscript represent variances associated with main effects, components with two subscripts two-way interactions, and the only component with three subscripts represents a three-way-interaction confounded with error.

Let’s consider one of these variance components (you can also refer to them simply as variances) to see in more detail how they can be interpreted. Take σ2(p), the person-variance. Note that this is an alternative symbol for the variance, in the figure, the p is in the subscript in stead of between brackets (I am sorry for the inconvenience of switching symbols, but I do not want to rely too much on mathjax ($sigma^2_p = sigma^2(p)$) and I do not want to change the symbols in the figure).

The variance σ2(p) is the expected squared deviation of the score of an idealized randomly selected person and the expectation of this score, the population mean. This score is the person score averaged of the conditions of the experiment and all of the items that could have been selected for the experiment. (This conceptualization is from Generalizability Theory; the Venn-diagram representation as well), the person score is also called the universe score of the person).

The component represents E((μp – μ)2), the expected squared person effect. Likewise, the variance associated with items σ2(i) is the expected squared item effect, and σ2(cp), is the expected squared interaction effect of condition and person.

The figure indicates that the total variance is (modeled as) the sum of seven independent variance components. The Precision app asks you to supply the values for six of these components (the components associated with the random effects), and now I hope it is a little clearer why these components are also referred to as expected squared effects.

Relative error variance of a treatment mean

The basic goal of contrast analysis is to compare a mean (or more) relative to one (or more) other treatment means. That is, we are interested in the relative position of a mean compared to the rest.  Due to sampling error our estimate of the relative position of a mean differs from the ‘true’ relative position. The relative error variance of a treatment mean is the expected squared deviation between the obtained relative position and the expected relative position. 
Let’s consider the Venn-diagram above again. In particular, take a look at the condition-circle and the components contained in it. A total of four variance components are included in the circle. The component  Θ2(c), is the component associated with the treatment effect (μc – μ).  All the other components contained in the circle contribute to the relative error variance. Thus, the interaction of treatment and participant, the interaction of treatment and stimulus, and the error contribute to the deviation between the true effect (relative position) and the estimated effect. Or, in other words, the relative error variance of the treatment mean consists of the three variance components associated with the treatment by participant interaction, the treatment by stimulus interaction, and error.

But these components specify the variance in terms of individual measurements, whereas the treatment mean is obtained on the basis of averaging over the np*ni measurements we have in the corresponding treatment condition. So let’s see how we can take into account the number of measurements.

Unfortunately, things get a little complicated to explain, but I’ll have a go nonetheless.  The explanation takes two steps: 1) We consider how to specify expected mean squares in terms of the components contained in the condition-circle 2) We’ll see how to get from the formulation of the expected mean square to the formulation of the relative error variance of a treatment mean.

Obtaining an expected mean square

I will use the term Mean Square (MS) to refer to a variance estimate. For instance, MST is an estimate of the variance associated with the treatment condition. The expected MS (EMS) is the average value of these estimates.

We can use the Venn-diagram to obtain an EMS for the treatment factor and all the other factors in the design, but we will focus on the EMS associated with treatment. However, we cannot use the variance components directly, because the mixed ANOVA model I have been using for the application contains sum-to-zero restrictions on the treatment effects and the two-way interaction-effects of treatment and participant and treatment and stimulus (item).  The consequence of this is that we will have to multiply the variance components associated with the treatment-by-participant and treatment-by-stimulus with a constant equal to nc / (nc – 1), where nc is the number of conditions.(This is the hard part to explain, but I didn’t really explain it, but simply stated it).

The second step of obtaining the EMS is to multiply the components with the number of participants and items, as follows. Multiply the component by the sample size if and only if the subscript of the component does not contain a reference to the particular sample size. That is, for instance, multiply a component by the number of participants np, if and only if the subscript of the component does not contain a subscript associated with participants.

This leads to the following:

 E(MST) = npniΘ2(T) + ni(nc / (nc – 1))σ2(cp) + np(nc / (nc – 1))σ2(ci) + σ2(cpi, e).

Obtaining the relative error variance of the treatment mean

Notice that  ni(nc / (nc – 1))σ2(cp) + np(nc / (nc – 1))σ2(ci) + σ2(cpi, e) contains the components associated with the relative error variance. Because the treatment mean is based on np*ni scores, to obtain the relative error variance for the treatment mean, we divide by np*ni to obtain.

Relative error variance of the treatment mean = (nc / (nc – 1))σ2(cp) / np + (nc / (nc – 1))σ2(ci) / ni+ σ2(cpi, e) /  (npni).

As an aside, in the post describing the app, I have used the symbols σ2(αβ) to refer to nc / (nc – 1))σ2(cp), and σ2(αγ) to refer to (nc / (nc – 1))σ2(ci).

Comparing means: the error variance of a contrast 

From the relative error variance of a treatment mean, we can get to the variance of a contrast, simply by multiplying the relative error variance by the sum of the squared contrast weights. For instance, if we want to compare two  treatment means we can do so by estimating the contrast ψ = 1*μ1 + (-1)*μ2, where the values 1 and (-1) are the contrast weights. The sum of the squared contrast weights equals 2, the error variance of the contrast is therefore 2*(nc / (nc – 1))σ2(cp) / np + (nc / (nc – 1))σ2(ci) / ni+ σ2(cpi, e) /  (npni).

Note that the latter gives us the expected squared deviation between the estimated contrast value and the true contrast value (see also the explanation of the concept of variance above).

It should be noted that for the calculation of a 95% confidence interval for the contrast estimate (or for the Margin of Error; the half-width of the confidence interval) we make use of the square root of the error variance of the contrast. This square root is the standard error of the contrast estimate. The calculation of MOE also requires a value for the degrees of freedom. I will write about forming a confidence interval for a contrast estimate in one of the next posts.