Suppose you want to do a chi-square test for independence in jamovi, but you only have summary data. Fortunately it is super easy to do that in jamovi. Here is how.
This example is based on a question from an assignment I use in my Applied Statistics course (the assignment itself is from the instructor resources of the book Introduction to the New Statistics (first edition)).
The introductory text to the question is as follows.
To what extent might feeling powerful make you less considerate of the perspective of others? In one study (Galinsky et al., 2006), participants were manipulated to feel either powerful (High Power) or powerless (Low Power). They were then asked to write an ‘E’ on their forehead with a washable marker. Those who wrote the ‘E’ to be correctly readable from their own perspective—looking from inside the head—were considered ego-centric (Ego); those who
wrote it to be readable to others were considered to be non-ego-centric (Non-Ego).
Table 1 contains the data of the original study.
| Ego | Non-Ego | Total | |
| High Power | 8 | 16 | 24 |
| Low Power | 4 | 29 | 33 |
| Total | 12 | 45 | 57 |
Creating the dataset using summary data in jamovi
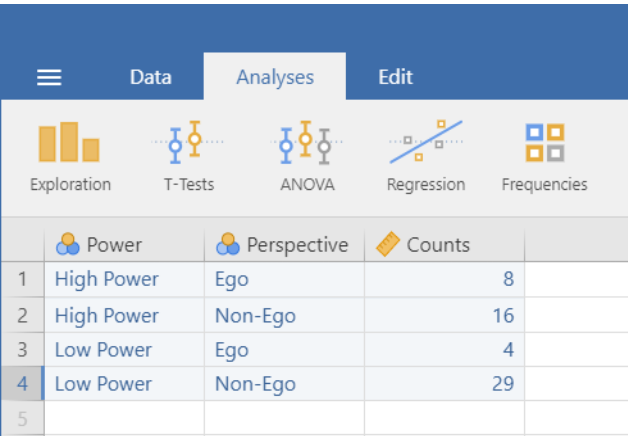
All you need to do is to a create a dataset with three variables. The first two variables are nominal variables. These variable define the rows and columns of your contingency table. Here, I opted for the variables Power, with levels 1 = High Power and 2 = Low Power and Perspective, with levels 1 = Ego and 2 = Non-Ego.
The third variable is the variable Counts (which can be nominal, ordinal and continuous, a far as I can tell). The count variable contains the number of observations for each combination of the two categorical variables.
This is what the dataset looks like:
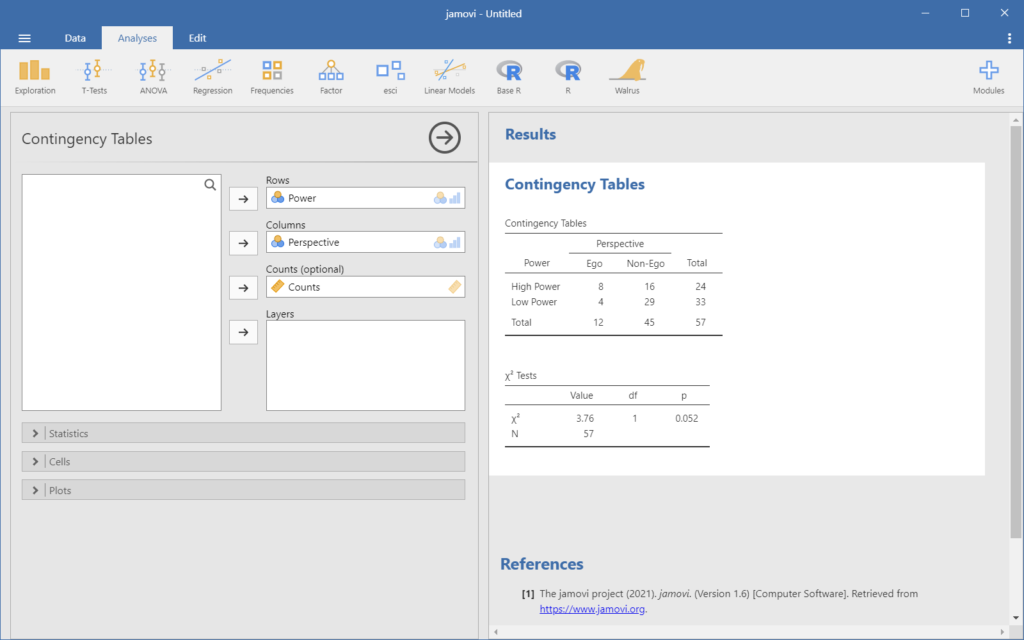
Doing the chi-square test
If you have the dataset, the rest is super easy as well. Just choose Frequencies on the Analyses tab followed by Independent samples. Now place your row, columns and counts variables in the right spot, as in Figure 2. That’s all!