Chi-square test with summary data in jamovi

Suppose you want to do a chi-square test for independence in jamovi, but you only have summary data.  Fortunately it is super easy to do that in jamovi. Here is how.

This example is based on a question from an assignment I use in my Applied Statistics course (the assignment itself is from the instructor resources of the book Introduction to the New Statistics (first edition)).

The introductory text to the question is as follows.

To what extent might feeling powerful make you less considerate of the perspective of others?  In one study (Galinsky et al., 2006), participants were manipulated to feel either powerful (High  Power) or powerless (Low Power). They were then asked to write an ‘E’ on their forehead with a washable marker. Those who wrote the ‘E’ to be correctly readable from their own perspective—looking from inside the head—were considered ego-centric (Ego); those who
wrote it to be readable to others were considered to be non-ego-centric (Non-Ego).

Table 1 contains the data of the original study.

Ego Non-Ego Total
High Power 8 16 24
Low Power 4 29 33
Total 12 45 57
Table 1. Contingency table with the original data

Creating the dataset using summary data in jamovi

All you need to do is to a create a dataset with three variables. The first two variables are nominal variables. These variable define the rows and columns of your contingency table. Here, I opted for the variables Power, with levels 1 = High Power and 2 = Low Power and Perspective, with levels 1 = Ego and 2 = Non-Ego.

The third variable is the variable Counts (which can be nominal, ordinal and continuous, a far as I can tell). The count variable contains the number of observations for each combination of the two categorical variables.

This is what the dataset looks like:

Jamovi dataset with summary data for a chi-square test.
Figure 1. Jamovi dataset containing summary data for the chi-square test.

Doing the chi-square test

If you have the dataset, the rest is super easy as well. Just choose Frequencies on the Analyses tab followed by Independent samples. Now place your row, columns and counts variables in the right spot, as in Figure 2. That’s all!

Details of the chi-square test in jamovi.
Figure 2. input and output of the chi-square test using summary data in jamovi.

Comparing the quantiles of two groups

Comparing the quantiles of two groups provides information that is lost by simply looking at means or medians. This post shows how to do that.

Traditionally,  the comparison of two groups focuses on comparing means or medians.  But, as Wilcox (2012) explains, there are many more features of the distributions of two groups that we may compare in order to shed light on how the groups differ. An interesting approach is to estimate the difference between the quantiles of the two groups.  Wilcox (2012, pp. 138-150) shows us an approach that is based on the shift function. The procedure boils down to estimating the quantiles of both groups, and plotting the quantiles of the first group against the difference between the quantiles.

In order to aid in comparing the quantiles of the groups, I’ve created a function for R that can be used for plotting the comparison between the two groups. The functions uses the ggplot2 package and the WRS package (that can be found here: WRS: A package of R.R. Wilcox’ robust statistics functions version 0.24 from R-Forge (rdrr.io)) ; see also: Installation of WRS package (Wilcox’ Robust Statistics) | R-bloggers (r-bloggers.com).).

library(WRS)
library(ggplot2)

plotSband <- function(x, y, x.name = "Control") {
  x <- sort(x[!is.na(x)])
  y <- sort(y[!is.na(y)]) 
  qhat <- 1:length(x)/length(x)
  idx.y <- floor(qhat*length(y) + .5)
  idx.y[idx.y <= 0] <- 1
  idx.y[idx.y > length(y)] <- length(y)
  
  delta <- y[idx.y] - x
  
  cis <- WRS::sband(x, y, plotit=F)$m[, c(2, 3)]
  
  check.missing <- apply(cis, 2, function(x) sum(is.na(x)))
  if (sum(check.missing == length(x)) > 1) {
    stop("All CI limits equal to - or + Infinity")
  }
  ylims <- c(min(cis[!is.na(cis[,1]), 1]) - .50, 
             max(cis[!is.na(cis[,2]), 2]) + .50)
  
  cis[is.na(cis[, 1]), 1] <- ylims[1]*5
  cis[is.na(cis[, 2]), 2] <- ylims[2]*5
  
  thePlot <- ggplot(mapping = aes(x)) + 
    xlab(x.name) + 
    geom_smooth(aes(x = x, y = delta), se = F, col="blue") + 
    ylab("Delta") +
    geom_point(aes(x = quantile(x, c(.25, .50, .75)), 
                   y = rep(ylims[1], 3)), pch=c(3, 2, 3), size=2) +
    geom_ribbon(aes(ymin = cis[,1], ymax = cis[,2]), alpha=.20) + 
    coord_cartesian(ylim = ylims)
  suppressMessages(print(thePlot))
}

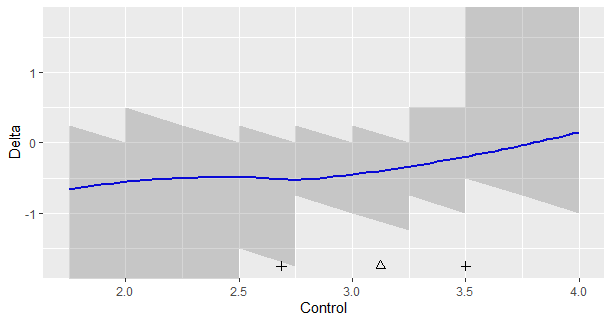
Let’s look at an example. Figure 1 presents data from an experiment investigating the persuasive effect of narratives on intentions of adopting a healthy lifestyle (see for details Boeijinga, Hoeken, and Sanders (2017)). The plotted data are the differences in intention between the quantiles of a group of participants who read a narrative focusing on risk-perception (detailing the risks of unhealthy behavior) and a group of participants who read a narrative focusing on action-planning (here called the control group), focusing on how the healthy behavior may actually be implemented by the participant.

Comparing the quantiles of two groups
Figure 1. Output from the plotSband-function

Figure 1 shows the following. The triangle is the median of the data in the control group, and the plusses the .25th and .75th quantiles. The shaded regions define the simultaneous 95% confidence intervals for the differences between the quantiles of the two groups. Here, these regions appear quite ragged, because of the discrete nature of the data. For values below 2.5 and above 3.5, the limits (respectively the lower and upper limits of the 95% CI’S) equal infinity, so these values extend beyond the limits of the y-axis. (The sband function returns NA for these limits). The smoothed-regression line should help interpret the general trend.

How can we interpret Figure 1? First of all, if you think that it is important to look at statistical significance, note that none of the 95% intervals exclude zero, so none of the differences reach the traditional significance at the .05 level. As we can see, none of them exclude differences as large as -0.50 as well, so we should not be tempted to conclude that because zero is in the interval that we should adopt zero as the point-estimate. For instance, if we look at x = 2.5, we see that the 95% CI equlas [-1.5, 0.0], the value zero is included interval, but so is the value -1.5. It would be unlogical to conclude that zero is our best estimate if so many values are included in the interval.

The loess-regression line suggests that the differences in quantiles between the two groups of the narrative is relatively steady for the lower quantiles of the distribution (up to the x = 3.0, or so; or at least below the median), but for quantiles larger than the median the effect gets smaller and smaller until the regression line crosses zero at the value x = 3.75. This value is approximately the .88 quantile of the distribution of the scores in the control condition (this is not shown in the graph).

The values on the y-axis are the differences between the quantiles. A negative delta means that the quantile of the control condition has a larger value than the corresponding quantile in the experimental condition. The results therefore suggest that participants in the control condition with a relatively low intention score, would have scored even lower in the other condition. To give some perspective: expressed in the number of standard deviations of the intention scores in the control group a delta of -0.50 corresponds to a 0.8 SD difference.

Note however, that due to the limited number of observations in the experiment, the uncertainty about the direction of the effect is very large, especially in the tails of the distribution (roughly below the .25 and above the .75 quantile). So, even though the data suggest that Action Planning leads to more positive intentions, especially for the lower quantiles, but still considerably for the .75 quantile, a (much) larger dataset is needed to obtain more convincing evidence for this pattern.

Cohen’s d for paired designs

For the paired design, which is traditionally used to obtain data for the paired t-test, we can calculate a standardized mean difference, Cohen’s d, using the average of the standard deviations of the two conditions. Cohen’s d for paired designs can be calculated as follows.

d_{av} =\frac{(M_1 - M_2)}{s_{av}}, \tag{1}

where s_{av} equals

s_{av}= \sqrt{\frac{1}{2}(S^2_1+S^2_2)}. \tag{2}

Now, (1) is of course an estimate of (3), the population value of Cohen’s d for paired designs, but we do not only need a point estimate, but also a confidence interval.

The following R-code can be used to obtain a 95% confidence interval for the estimate of \delta_{av}, the population mean difference standardized by using the average of the two standard deviations:

\delta_{av} = \frac{\mu_1 - \mu_2}{\sqrt{\frac{1}{2}(\sigma_1^2 + \sigma_2^2)}} , \tag{3}

This procedure uses the approximate procedure by Algina & Keselman (2003), which is also used by ESCI (Cumming, 2012; Cumming and Calin-Jageman, 2017), as Kline (2013) explains. The following steps are performed to obtain the 95% confidence interval.

  1. Use the obtained t-value of the paired t-test to estimate the non-centrality parameter \lambda. Steps 2 and 3 are for calculating a 95% confidence interval for the non-centrality parameter.
  2. Use an iterative procedure to find the non-centrality parameter of the t-distribution for which the observed t-value is the .025 quantile. This is the upper limit of the confidence interval for the non-centrality parameter.
  3. Use an iterative procedure to find the non-centrality parameter of the t-distribution for which the observed t-value is the .975 quantile. This is the lower limit of the confidence interval for the non-centrality parameter.
  4. To obtain a CI for \delta_{av} multiply the limits of the confidence interval for the non-centrality parameter by the value \sqrt{\frac{2S_D^2}{n(S_1^2+S_2^2)}} where n is the sample size, S_D^2 the variance of the difference scores , and S_1^2 and S_2^2 the variances of the two variables.

The following R-function does all the work. Note that with large potential values for the noncentrality parameter R issues warnings that “full precision has not been achieved in ‘pnt{final}'”. These warnings can be ignored ( I checked many examples against ESCI’s output), but in order to prevent them, I let the optimize function search from the observed value of t to maximally five times its value, and I have included the option to suppress warnings or not (just set warn = TRUE to get the warnings).

ci.d.av <- function(t, n, s.1, s.2, s.diff, warn = FALSE) {
  if (t < 1) {
    lims <- c(-5, 5)
  } else {
    lims <- c(-5*abs(t), 5*abs(t))
  }
  df = n - 1
  multiplier = sqrt((2*s.diff^2) / (n*(s.1^2 +  s.2^2)) )
  loss <- function(x, prob) (pt(t, df, x) - prob)^2  
  if (warn == FALSE) {
    ul <- suppressWarnings(optimize(loss, lims, prob=.025))$minimum 
    ll <- suppressWarnings(optimize(loss, lims, prob=.975))$minimum
  } else {
    ul <- optimize(loss, lims, prob=.025)$minimum 
    ll <- optimize(loss, lims, prob=.975)$minimum
  } 
    return(round(c(ll, ul), 4)*multiplier)  
}

The arguments of the function are t, the t-value of the t-test testing the hypothesis of equal population means, the sample size (n), the standard deviations (s.1 and s.2) of the two variables and the standard deviation of the difference scores (s.diff).

Calculating Cohen’s d for paired designs: an example

Here is a quick example.

library(MASS)
set.seed(1234)

# generate random multivariate normal data with sample size n = 20

theData <- mvrnorm(20, c(.5, .0), matrix(c(1, .8, .8, 1), 2, 2))

# calculate the standard deviations 

sds <- apply(theData, 2, sd)

# calculate the standard deviation of difference scores 

sDiff <- sd(theData[,1] - theData[,2])

# get t.value and a value for d.av 
# here I use the output of the t-test in R to obtain t and the mean
# difference score (needed for calculating d.av)

theTest <- t.test(theData[,1], theData[,2], paired=TRUE)
t = theTest$statistic
d.av = theTest$estimate / mean(sds)

ci.d.av(t = t, n = 20, s.1 = sds[1], s.2 = sds[2], sDiff)

The results are that the estimate equals d_{av} = 0.87, 95\% \text{CI} [0.51, 1.22].

Alternatively, we can make use of the conf.limits.nct function of the MBESS package (Kelley, 2007a, 2007b), and proceed as follows (using the data generated above).

library(MBESS)

ci.d.av.2 <- function(t, n, s.1, s.2, s.diff) {
  df = n - 1
  multiplier = sqrt((2*s.diff^2) / (n*(s.1^2 +  s.2^2)) )
  unlist(conf.limits.nct(t, df)[c(1,3)])*multiplier
}

ci.d.av.2(t = t, n = 20, s.1 = sds[1], s.2 = sds[2], s.diff = sDiff). 

References

Algina, J. & Keselman, H. J. (2003). Approximate confidence intervals for effect sizes. Educational and Psychological Measurement, 63, 721-734.

Cumming, G. (2012). Understanding the New Statistics. Effect Sizes, Confidence Interval, and Meta-Analysis. New York: Routledge.

Cumming, G. & Calin-Jageman, R. (2017). Introduction fo the New Statistics. Estimation, Open Science, and Beyond. New York: Routledge.

Kelley, K. (2007b). Confidence intervals for standardized effect sizes: Theory, application, and implementation. Journal of Statistical Software20(8), 1-24.

Kelley, K. (2007a). Methods for the Behavioral, Educational, and Social Sciences: An R Package. Behavior Research Methods39, 979–984.

Kline, R.b. (2013). Beyond Significance Testing. Statistics Reform in the Behavioral Sciences. (Second Edition). Washington: APA.

Distribution of the difference between two binomial variables

For a project I’m working on, I needed to work with the probabilities associated with the difference between two binomial variables. I thought I’d share the code for four functions for calculating the probability mass and the cumulative probabilites.

The functions d.diff.binom (probability mass) and p.diff.binom (cumulative distribution) are functions for calculating the distribution of the differences for equal sample sizes N and equal “succes” probability.  The arguments of the functions are the quantiles k of the distribution of the differences, the number of trials N and the probability of succes p. 

The functions d.diff.binom.un (probability mass) and p.diff.binom.un (cumulative distribution) are functions for calculating the distribution of the differences for sample sizes and succes probabilities that may (or may not) differ between the two populations. The arguments of the functions are the quantiles k of the distribution of the differences, the number of trials N.1 and N.2 for the two groups and the probability of succes p.1 and p.2 for each group. 


#equal N and p:
#probability mass:
d.diff.bin = function(k, N, p) {
diff = outer(0:N, 0:N, "-")
prob = outer(dbinom(0:N, N, p, log=TRUE),
dbinom(0:N, N, p, log=TRUE), "+")
p = sum(exp(prob))
return(p)
}
#cumulative probability:
p.diff.bin = function(k, N, p) {
diff = outer(0:N, 0:N, "-")
prob = outer(dbinom(0:N, N, p, log=TRUE),
dbinom(0:N, N, p, log=TRUE), "+")
p = sum(exp(prob))
return(p)
}
#examples
d.diff.bin(0, 30, .50)
## [1] 0.1025782
p.diff.bin(0, 30, .50)
## [1] 0.5512891
#mean of distribution:
N = 30
m = sum(sapply(-N:N, d.diff.bin, N = 30, p= .50)*(-N:N))
m
## [1] -3.084642e-20
all.equal(0, m)
## [1] TRUE
#(un)equal N and p:
#probability mass:
d.diff.bin.un = function(k, N.1, N.2, p.1, p.2) {
diff = outer(0:N.1, 0:N.2, "-")
prob = outer(dbinom(0:N.1, N.1, p.1, log=TRUE),
dbinom(0:N.2, N.2, p.2, log=TRUE), "+")
p = sum(exp(prob))
return(p)
}

#cumulative distribion: 
p.diff.bin.un = function(k, N.1, N.2, p.1, p.2) {
diff = outer(0:N.1, 0:N.2, "-")
prob = outer(dbinom(0:N.1, N.1, p.1, log=TRUE),
        dbinom(0:N.2, N.2, p.2, log=TRUE), "+")
p = sum(exp(prob))
return(p)
}

#examples
d.diff.bin.un(0, 30, 20, .60, .70)
## [1] 0.05896135
p.diff.bin.un(0, 30, 20, .60, .70)
## [1] 0.1497043

A rule of thumb for setting target MOE

One of the most difficult aspects of sample size planning for precision is the specification of a target Margin of Error (MoE). Here, I would like to introduce a simple rule of thumb, in the hope that it helps you in determining a reasonable target MoE.
Here, the rule of thumb is applied to obtaining an estimate of the difference between two independent group means, where the two populations are normally distributed with equal variances.

Goal 1: Assessing the direction of an effect

Sample size planning starts with formulating a goal for the research. A very common goal is to try to determine the direction of an effect. For the goal of assessing the direction of an effect, it helps if the confidence interval of the difference contains only positive or negative values. That is, you want a confidence interval that exludes the value 0, for if that value is included, you would probably conclude that the estimate is consistent with both positive and negative effects. Thus, our first goal is to obtain a confidence interval of the mean difference that excludes the value 0.

Now, a confidence interval excludes 0, if obtained MOE is at most equal to the obtained effect size estimate. Suppose that the estimate equals the true effect of say, 0.50, we want MOE to be at most very close to 0.50, otherwise 0 will be included in the interval. But if our estimate underestimates the true effect, say the estimate equals 0.30, we want MOE to be at most very close to 0.30. Likewise, if we overestimate the effect, MOE can be larger than 0.50.

This means that we cannot say, for instance, we expect that the true effect is .50, so let’s plan for a target MOE that with 80% assurance is at most .50, because this target MOE may be too large for underestimates of the true effect, depending on the extent to which the effect is underestimated. So, in specifying target MOE, we should take into account that underestimates of the effect size occur. (Actually, these underestimates occur with a relative frequency of 50% in a huge collection of direct replications). We can say that we do not only want to exclude zero from the interval, but also that we want that to occur in a large proportion of direct replications. This will be our second goal. I will call the probabiity associated with our second goal, the probability of exclusion (PE)

The rule of thumb is that if we want 80% probability that a random confidence interval excludes zero, we should plan for an expected MOE equal to f = d / √2. (the square root sign is unreadable in my browser; so in words: the effect size divided by the square root of 2; with mathjax: $f = d / sqrt{2}$). Since there is 50% probability that obtained MOE will be larger than expected MOE, this is equal to planning for target MOE = f = d / √2, with 50% assurance or simply without assurance. You can do this in the ESCI-software, but also with the R-functions provided below.

The first example in the code below, is an illustration of planning for assessing the direction of the effect, with true effect size d = .50. If we want 80% assurance to have only positive values in our confidence interval, we should plan for a target MoE = expected MoE = f = d / √2 = 0.3535. Using the SampleSize-function below, this gives a sample size n = 63, or total sample size = N = 2*63 = 126. The probability that the confidence interval excludes 0 equals approximately 80% (p = 0.7951). So, the rule of thumb of planning for d / √2, seems to work pretty good.

Goal 2: distinguishing between effect sizes

If your research goal is to estimate the value of the effect size in stead of its direction, the rule of thumb can be used as follows. Suppose we do not know the true effect size, but want to have 80% assurance that we have a high probability to be able to distinguish between small (d = .20) and large effects (d = .80). That is, if the true effect is .20 we want the value .80 to be excluded from the confidence interval and if the true effect is .80, we want the value .20 to be excluded from the confidence interval.

We can proceed as follows, the difference between the effect sizes is .80 – .20 = .60. We use this value to determine target MOE. Thus, if we now plan for a target MoE = expected Moe = d / √2), we should have approximately 80% PE that obtained MoE will exclude 0.80 if the true effect is 0.20 and vice versa. The functions below give sample size n = 44, and the probablity of exclusion equals .7947. So, our rule of thumb, seems to work pretty good again. See example 2 in the code below.

Alternatively, we could take the region of practical equivalence (ROPE) into account. Suppose, our equivalence range equals .10 sigma. If we want to have enough precision to distinguish large from small effects, we should plan as follows. We take the difference between a large effect and the upper equivalence value of a small effect or, equivalently, the difference between a small effect and the lower equivalence vaue of a large effect, i.e. .50, and plan for f = .50 / √2. If the effect is large we expect a confidence interval that excludes the equivalence range for the small effect (and vice versa), with 80% probability of exclusion.

But we could also take the difference between the lower equivalence value of a large effect and the upper equivalence value of a small effect, i.e. .40, and plan for f = .40/√2. (See the third example in the code below) This will give us 80% PE that any true value within the ROPE of the one effect will exclude values in the ROPE of the other. For example, if the true effect is .70, and expected MOE equals .40/√2 = .2828, there is approximately 80% probability that the 95% CI excludes .30, which is in the ROPE of a small effect. The expected CI will be .70 +/- .2828 = [0.4172, 0.9828]. Note that the lower limit is larger than the upper limit of the ROPE for d = .20, as we want it to be. Note, however, that if the true effect is small (d = .20), the CI will exclude effects equivalent to large effects, which is consistent with our research goal, but it will not exlude the value 0 or effects equivalent to a medium effect. Indeed, the expected CI will be [-0.0828, 0.4828]. (This is not a problem, of course, since this was not the purpose of our research)

As a final example, suppose we want sufficient precision to distinguish small from medium effects (or large from medium effects). If we take the ROPE perspective, with an equivalence range of +/- .10 sigma, the lower equivalence value of the medium effect equals .50 – .10 = .40 and the upper limit of the small effect equals .30. If we want 80% assurance that the CI will be small enough to distinguish small from medium effects, we should plan for expected MOE f = (.40 – .30)/√2 = 0.0707. Using the functions below, this requires a sample size n = 1538. (See the final example in the code below).

Setting target MOE: conclusion

In summary, the rule of thumb is to divide the effect size d by √2 and plan for an expected MoE equal to this value. This will give you a sample size that gives approximately 80% assurance that the CI will not contain 0. In the case of distinguishing effect sizes, one option is to divide the difference between the lower equivalence value of the larger effect and the upper equivalence value of the smaller effect by the square root of 2 and plan for an expected MoE equal to this value. This will give you a sample size that gives approximately 80% PE that the CI of the estimated true value of one effect excludes the values in the ROPE of the other effect.

Do you want at least 90% PE? Use the square root of three, in stead of the square root of two, in determining target MoE.

eMoe = function(n) {
eMoe = qt(.975, 2*(n - 1))*sqrt(2/n)
return(eMoe)
}

cost <- function(n, tMoe) {
(eMoe(n) - tMoe)^2
}

sampleSize <- function(tMoe) {
optimize(cost, interval=c(10, 5000), tMoe = tMoe)$minimum
}

# FIRST EXAMPLE
# plan for 80% assurance of excluding 0
# i.e. estimate the direction if true effect
# equals .50 

d = .50

#application of rule of thumb:
f = .50 / sqrt(2)

#sampleSize (uses ceiling() to round up): 
n = ceiling(sampleSize(f))
n
## [1] 63
# Probabiity of Exclusion (here taken to be equivalent to
# power for two-sided t-test (since true direction is unknown))
df = 2*(n - 1)
ncp = f / sqrt(1/n) #or ncp = d / sqrt(2/n)

pt(qt(.025, df), df, ncp) + 1 - pt(qt(.975, df), df, ncp)
## [1] 0.7951683
# SECOND EXAMPLE: 
# distinguish between small and large effect sizes: 
d = .80 - .20
f = d / sqrt(2)

n = ceiling(sampleSize(f))
n
## [1] 44
df = 2*(n - 1)
ncp = f / sqrt(1/n) #or ncp = d / sqrt(2/n)

#PE: 

pt(qt(.025, df), df, ncp) + 1 - pt(qt(.975, df), df, ncp)
## [1] 0.79467
# EXAMPLE 3: distinguish small and large with ROPE
# ROPE small and large: 
rope.small = c(.10, .30)
rope.large = c(.70, .90)

d = rope.large[1] - rope.small[2]
f = d / sqrt(2)

n = ceiling(sampleSize(f))

n
## [1] 98
df = 2*(n - 1)
ncp = f / sqrt(1/n) #or ncp = d / sqrt(2/n)

#PE: 

pt(qt(.025, df), df, ncp) + 1 - pt(qt(.975, df), df, ncp)
## [1] 0.7956414
# Example 4: distinguish medium from small 
# or medium from large with ROPE

rope.medium = c(.40, .60)
d = rope.medium[1] - rope.small[2]
f = d / sqrt(2)

n = ceiling(sampleSize(f))

n
## [1] 1538
df = 2*(n - 1)
ncp = f / sqrt(1/n) #or ncp = d / sqrt(2/n)

#PE:

pt(qt(.025, df), df, ncp) + 1 - pt(qt(.975, df), df, ncp)
## [1] 0.7916783

Sample size planning for precision: the basics

In this post, I will introduce some of the ideas underlying sample size planning for precision. The ideas are illustrated with a shiny-application which can be found here: https://gmulder.shinyapps.io/PlanningApp/. The app illustrates the basic theory considering sample size planning for two independent groups. (If the app is no longer available (my allotted active monthly hours are limited on shinyapps.io), contact me and I’ll send you the code).

The basic idea

The basic idea is that we are planning an experiment to estimate the difference in population means of an experimental and a control group. We want to know how many observations per group we have to make in order to estimate the difference between the means with a given target precision. 
Our measure of precision is the Margin of Error (MOE).  In the app, we specify our target MOE as a fraction (f) of the population standard deviation. However, we do not only specify our target MOE, but also our desired level of assurance. The assurance is the probability that our obtained MOE will not exceed our target MOE. Thus, if the assurance is .80 and our target MOE is f = .50, we have a probability of 80% that our obtained MOE will not exceed f = .50. 
The only part of the app you need for sample size planning is the “Sample size planning”-form. Specify f, and the assurance, and the app will give you the desired sample size. 
If you do that with the default values f = .50 and Assurance  = .80, the app will give you the following results on the Planning Results-tab:  Sample Size: 36.2175, Expected MOE (f): 0.46. This tells you that you need to sample 37 participants (for instance) per group and then the Expected MOE (the MOE you will get on average) will equal 0.46 (or even a little less, since you sample more than 36.2175 participants). 
The Planning-Results-tab also gives you a figure for the power of the t-test, testing the NHST nil-hypothesis for the effect size (Cohen’s d) specified in the “Set population values”-form. Note that this form, like the rest of the app provides details that are not necessary for sample size planning for precision, but make the theoretical concepts clear. So, let’s turn to those details. 

The population

Even though it is not at all necessary to specify the population values in detail, considering the population helps to realize the following. The sample size calculations and the figures for expected MOE and power, are based on the assumption that we are dealing with random samples from normal populations with equal variances (standard deviations). 
From these three assumptions, all the results follow deductively.  The following is important to realize:  if these assumptions do not obtain, the truth of the (statistical) conclusions we derive by deduction is no longer guaranteed. (Maybe you have never before realized that sample size planning involves deductive reasoning; deductive reasoning is also required for the calculation of p-values and to prove that 95% confidence intervals contain the value of the population parameter in 95% of the cases; without these assumptions is it uncertain what the true p-value is and whether or not the 95% confidence interval is in fact a 95% confidence interval).

In general, then, you should try to show (to others, if not to yourself) that it is reasonable to assume normally distributed populations, with equal variances and random sampling, before you decide that the p-value of your t-test, the width of your confidence interval, and the results of sample size calculations are believable.

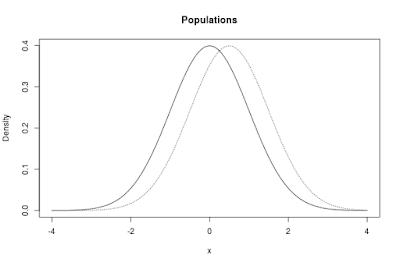
The populations in the app are normal distributions. By default, the app shows two such distributions. One of the distributions, the one I like to think about as corresponding to the control condition, has μ = 0, the other one has μ = 0.5. Both distributions have a standard deviation (σ = 1). The standardized difference between the means is therefore equal to δ = 0.50.

The default populations are presented in Figure 1 below.
normal populations
Figure 1: Two normal distributions. The distribution to the left has μ = 0, the one to the right has μ = 0.5 The standard deviation in both distributions equals σ = 1. The standardized difference δ and the unstandardized difference between the means both equal 0.50. 

The sampling distribution of the mean difference 

The other default setting in the app is a sample size (per group) of n = 20.  From the sample size and the specification of the populations, we can deduce the probability density of the different values of the estimates of the difference between the population means. The estimate is simply the difference between the sample means.

This so-called sampling distribution of the mean difference is depicted on the tab next to the population. Figure 2 shows what the sampling distribution looks like if we repeatedly draw random samples of size n = 20 per group from our populations and keep track of the difference between the sample means we get in each repetition.

sampling distribution of difference
Figure 2: Sampling distribution of the difference between two sample means based on samples of n = 20 per group and random sampling from the populations described in Figure 1. 

Note that the mean of the sampling distribution equals 0.5 (as indicated by the middle vertical line). This is of course the (default) difference between the population means in the app. So, on average, estimates of the population difference equal the population difference.

The lines to the left and the right of the mean indicate the mean plus or minus the Margin of Error (MOE). The values corresponding to the lines are 0.5 ± MOE. 95% of estimates of the population mean difference have a value between these lines.

Conceptually, the purpose of planning for precision is to decrease the (horizontal) distance between these lines and the population mean difference. In other words, we would like the left and right lines as close to the mean of the distribution as is practically acceptable and possible.

The distribution of the t-statistic 

The tab next to the sampling distribution tab contains a figure representing the sampling distribution of the t-statistic. The sampling distribution of t can be deduced on the basis of the population values and the sample size.  In the app, it is assumed that t is calculated under the assumption that the null-hypothesis of zero difference between the means is true. The sampling distribution of t is what you get if you repeatedly sample from the populations as specified, calculate the t-statistic and keep a record of the values of the t-statistic.

The sampling distribution of the t-statistic presented in Figure 3 contains two vertical lines. These lines are located (horizontally) on the value of t that would lead to rejection of the null-hypothesis of equal population means. In other words, the lines are located at the critical value of t (for a two-tailed test).

distribution of t
Figure 3: Distribution of the t-statistic testing the null-hypothesis of equal population means. The distribution is based on sampling from the populations described in Figure 3. The sample size is n = 20 per group. The lines represent the critical value of t for a two sided t-test. The area between the vertical lines is the probability of a type II error. The combined areas to the left of the left line and to the right of the right line is the power of the test. 

The area between the lines is the probability that the null-hypothesis will not be rejected. In the case of a true population mean difference (which is the default assumption in the app), that probability is the probability of an error of the second kind: a type II error.

The complement of that probability is called the power of the test. This is, of course, the area to the left of the left vertical line added to the area to the right of the right vertical line. Conceptually, the power of the test is the probability of rejecting the null-hypothesis when in fact it is false.

Figure 3 clearly demonstrates that if the true mean difference equals 0.50 and the sample size (per group) equals n = 20, that there is a large probability that the null-hypothesis will not be rejected. Actually, the probability of a type II error equals .66. (So, the power of the test is .34).

Sample size planning for precision

With respect to sample size planning for precision, the app by default takes half of a standard deviation (f = .50) as the target MOE. Besides, planning is with 80% assurance. This means that the default settings search for a sample size (per group), so that with 80%  probability MOE will not exceed 0.50 (Note that the default value of the standard deviation is 1, so an f of .50 corresponds to a target MOE of  0.50 on the scale of the data; Likewise, were the standard deviation equal to 2, an f of .50 would correspond to a target MOE of 1.0).

As described above, planning with the default values gives us a sample size of  n = 37 per group, with an expected MOE of 0.46. In the tab next to the planning results, a figure displays what you can expect to find on average, given the planned sample size and the specification of the population. That figure is repeated here as Figure 4.

Expected results
Figure 4: Expected results in terms of point and interval estimates (95% confidence intervals). This is what you will find on average given the population specification in Figure 1 and using the default values for sample size planning. 

Figure 4 displays point and interval estimates of the group means and the difference between the means. The interval estimates are 95% confidence intervals. The figure clearly shows that on average, our estimate of the difference is very imprecise. That is, the expected 95% confidence interval ranges from almost 0 (0.50 – 0.46 = 0.04) to almost 1 (0.50 + 0.46 = 0.96). Of course, using n = 20, would be worse still.

A nice thing about the app (well, I for one think it’s pretty cool) is that as soon as you ask for the sample sizes, the sample size in the set population values form is automatically updated. Most importantly, this will also update the sampling distribution graphs of the difference between the means and the t-statistic. So, it provides an excellent way of showing what the updated sample size means in terms of MOE and the power of the t-test.

Let’s have a look at the sampling distribution of the mean difference, see Figure 5.

Sampling distribution of the difference.
Figure 5: Sampling distribution of the mean difference with n = 37 per group. Compare with Figure 2 to see the (small) difference in the Margin of Error compared to n = 20.  

If you compare Figures 5 and 2, you see that the vertical lines corresponding to the mean plus and minus MOE have shifted somewhat towards the mean. So here you can see, that almost doubling the sample size (from 20 to 37) had the desired effect of making MOE smaller.

I would like to point out the similarity between the sampling distribution of the difference and the expected results plot in Figure 4. If you look at the expected results for our estimate of the population difference, you see that the point estimate corresponds to the mean of the sampling distribution, which is of course equal to the populations mean difference and that the limits of the expected confidence interval correspond to the left and right vertical lines in Figure 5. Thus, on average the limits of the confidence interval correspond to the values that mark the middle 95% of the sampling distribution of the samples mean difference.

Since we specified an assurance of 80%, there is an 80% probability that in repeated sampling from the populations (see Figure 1) with n = 37 per group, our (estimated) MOE will not exceed half a standard deviation. Thus, whatever the true value of the populations mean difference is, there is a high probability that our estimate will not be more than half a standard deviation away from the mean. This is, I think, one of the major advantages of sample size planning for precision: we do not have to specify the unknown population mean difference. This is in contrast to sample size planning for power, where we do have to specify a specific population mean difference.

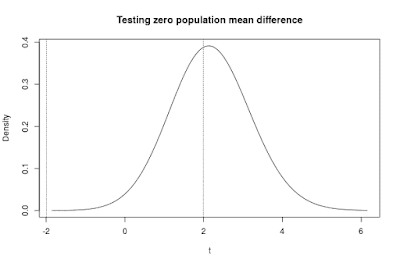
Speaking of power, the results of the sample size planning suggest that for our specification of the populations mean difference (Cohen’s delta = 0.50) the power of the test equals 0.56. Thus, there is a probability of 56% that with n = 37 per group the t-test will reject. The probability of a type II error is therefore 44%.

Figure 6 shows the distribution of the t statistic with n = 37 per group and a standardized effect size of 0.50.
Distribution of the t statistic
Figure 6. The distribution of the t-statistic testing the null-hypothesis of equal population means. The distribution is based on the population specification in Figure 1 and sample sizes of n = 37 per group, with true effect size equal to 0.50. The probability of a type II error is the area of under the curve between the two vertical lines. The power is the area under the curve beyond the two lines. Compare with Figure 3 to see the differences in these probabilities compared to n = 20.

Power versus precision

Now suppose that the unstandardized mean difference between the population means equals 2 and that the standard deviation equals 2.5.  I just filled in the set population values form, setting the mean of population 2 to 2.0 and the standard deviation to 2.5. And I clicked set values.

Let us plan for a target MOE of  f = 0.5 standard deviations with 80% assurance. Click get sample sizes in the sample size planning form. In this case, target MOE equals 1.25.

The results are not very surprising. Since the f did not change compared to the previous time, the results as regards the sample size are exactly the same. We  need n = 37. Again, this is what I like about sample size planning, no matter what the unknown situation in the population is, I just want my margin of error to be no more than half a standard deviation (for example).

But the power did change (of course). Since the standardized population mean difference is now 0.80 (= 2.0 / 2.5) in stead of 0.50, and all the other specifications remained the same, the power increases from 56% to 92%. That’s great.

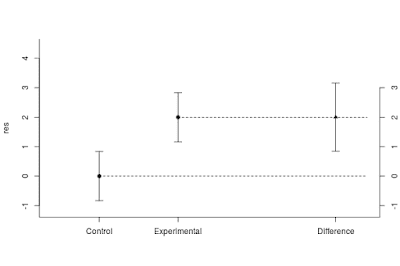
However, the high probability of rejecting the null-hypothesis does not mean that we get precise estimates. On average, the point estimate of the difference equals 2 and the 95% confidence limits are  0.85 and 3.15 (the point estimate plus or minus 0.46 times the standard deviation of 2.5). See Figure 7.
Expected results large standardized effect
Figure 7: Expected results using n = 37 when sampling from two normal populations with equal standard deviations (σ = 2.5) and mean difference of 2.0. The standardized effect size equals 0.80. Note the imprecision of the estimates even though the power of the t-test equals .92.

In short, even though there is a high probability of  (correctly) rejecting the null-hypothesis of equal population means, we are still not in the position to confidently conclude what the size of the difference is: the expected confidence interval is very wide. 

Scientific with a small s

My inspiration for this blog’s motto comes from Zilliak & McCloskey (2004). They quote from Bob Solow’s Nobel Prize acceptance speech, after which they write:

“Solow recommends we “try very hard to be scientific with a small s”; but the authors we have surveyed in the AER [American Economic Review, GM], by contrast, are trying to be scientific with a small t.” (p. 544).

Their “small t” refers to the t statistic on the basis of which researchers determine the p-values they use to assess the statistical significance of their findings. A small p (smaller than .05) is usually taken to mean that the test result is statistically significant.

There are a lot of reasons to believe that null-hypothesis significance testing (NHST) is basically unscientific. That’s why I got convinced that you cannot do science with a small p (significance testing). I hope that after reading the blog posts yet to come, you will be convinced as well.  (If you can’t wait: Kline (2014) (see below) is a good place to start getting convinced).

What does it mean to be scientific with a small s? To Solow (as cited in Zilliak & McCloskey, 2004) it simply means thinking logically and respecting the facts.  To my mind, thinking logically as a prerequisite of being scientific (with a small s) includes thinking logically about the results of statistical analyses. For instance, that you should not mistakenly believe that a small p value means that it is unlikely that a result is due to chance, or that you should not mistakenly believe that the long term behavior of a decision procedure has anything to do with the evidence in your actual data (the facts).

Zilliak & McCloskey (2004) write about economic research, but significance testing is of course not limited to economic research. Kline (2013, p. 118-199) concludes in his chapter about cognitive distortions in significance testing (and he is putting it mildly):

“Significance testing has been like a collective Rorschach inkblot test for the behavioral sciences: What we see in it has more to do with wish fulfillment than reality. This magical thinking has impeded the development of psychology and other disciplines as cumulative sciences. […] the gap between what is required for significance tests to be accurate and characteristics of real world studies is just too great.”

So, this blog is about being scientific with a small s, with a main focus on the logic and illogic of NHST, because you simply cannot do science with only a small p.

References
Kline, R.B. (2013). Beyond significance testing. Statistics reform in the behavioral sciences. Second Edition. Washington: APA.
Zilliak, S.T., & McCloskey, D.N. (2004). Size matters: the standard error of regressions in the American Economic Review, Journal of Socio-Economics, 33, 527-547.