In this tutorial I will show how contrast estimates can be obtained with R. Previous posts focused on the analyses in factorial between and within designs, now I will focus on a mixed design with one between participants factor and one within participants factor. I will discuss how to obtain an estimate of an interaction contrast using a dataset provided by Haans (2018).
I will illustrate two approaches, the first approach is to use transformed scores in combination with one-sample t-tests, and the other approach uses the univariate mixed model approach. As was explained in the previous tutorial, the first approach tests each contrast against it’s own error variance, whereas in the mixed model approach a common error variance is used (which requires statistical assumptions that will probably not apply in practice; the advantage of the mixed model approach, if its assumptions apply, is that the Margin of Error of the contrast estimate is somewhat smaller).
Again, our example is taken from Haans (2018; see also this post. It considers the effect of students’ seating distance from the teacher and the educational performance of the students: the closer to the teacher the student is seated, the higher the performance. A “theory “explaining the effect is that the effect is mainly caused by the teacher having decreased levels of eye contact with the students sitting farther to the back in the lecture hall. To test that theory, a experiment was conducted with N = 9 participants in a factorial mixed design (also called a split-plot design), with two fixed factors: the between participants Sunglasses (with or without), and the within participants factor Location (row 1 through row 4). The dependent variable was the score on a 10-item questionnaire about the contents of the lecture. So, we have a 2 by 4 mixed factorial design, with n = 9 participants in each combination of the factor levels.
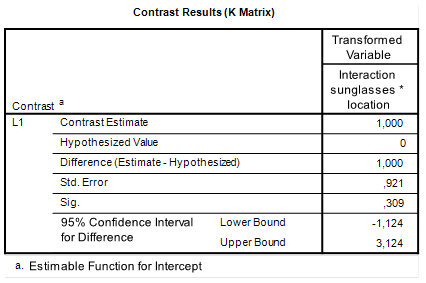
We will again focus on obtaining an interaction contrast: we will estimate the extent to which the difference between the mean retention score on the first row and those on the other rows differs between the conditions with and without sunglasses.
Continue reading “Contrast analysis with R: Tutorial for factorial mixed designs”