The independent and paired T-test in jamovi

This is a short tutorial on comparing two means with the independent and paired t-test in jamovi.

Description of the data

I have downloaded the dataset from the Mathematics and Statistics Help (MASH) site. The dataset contains data on 78 persons following one of three diets. I will use the dataset to show you how to estimate the difference between two means with the independent t-test analysis and the dependent t-test analysis in jamovi. I will ignore the different diets and focus on gender differences and pre- and post-weight differences instead.

I will focus on two substantive research questions.

  1. To what extent does following a diet lead to weight loss?
  2. To what extent does the weight lost differ between females and males?

The paired t-test in jamovi

Let’s start with the first research question. Statistical analysis can be useful for answering the research question, but then we will first have to translate the substantive question into a statistical one. Now, it seems reasonable to assume that if following a diet leads to weight loss, that the typical weight before the diet differs from the typical weight after following the diet. If we assume furthermore that the mean provides a good representation of what is typical, then it is plausible that the mean weight before the diet differs from the mean weight after the diet.

If we are interested in the extent to which means differ, we are – statistically speaking – interested in the extent to which expected values differ. So, our analysis will focus on finding out what our data have to say about the difference between the expected values. More concrete: we focus on the difference between the expected values for weight (measured in kg) before and after the diet. Using conventional symbols, we aim at uncovering quantitative information about the difference \mu_{pre\ weight} – \mu_{post\ weight}.

Since all persons were measured pre and post diet, the measurements are likely to be correlated. Indeed, the sample correlation equals r = .96. We need to take this correlation into account and that is why we use the statistical techniques for estimation and testing that are available in the paired t-test analysis in jamovi.

Doing the paired t-test in jamovi

In a real research situation, we would of course start with descriptive analyses to figure out what the data seem to suggest about the extent to which a diet leads to weight loss. But now we are just looking at how to obtain the relevant inferential information from jamovi.

I have chosen the following options for the analysis.

Choosing Jamovi paired t-test options
Figure 1. Paired t-test analysis options in jamovi

Since we are interested in the extent to which following a diet leads to weight loss, it is important to realize that the t-test in itself does not necessarily provide useful information. Why? Because the t-test gives us input to make the decision whether to reject the null-hypothesis that the expected values are equal, and only indirectly provides us with the information about the extent to which the expected values differ, and the latter is of course what we are interested in: we want quantitative information! The more useful information is provided by the estimate of the mean difference and the 95% Confidence Interval.

The paired t-test output

The relevant output for the t-test and the estimation results are presented in Figure 2.

Jamovi paired t-test output
Figure 2. Significance test and estimation results of the paired t-test analysis in jamovi

Let’s start with the t-test. The conventional null-hypothesis is that the expected values of the two variables are equal ( \mu_{pre\ weight} = \mu_{post\ weight}, or \mu_{pre\ weight} – \mu_{post\ weight} = 0. . The alternative hypothesis is that the expected values are not equal. Following convention, we use a significance level of \alpha = .05, so that our decision rule is to reject the null-hypothesis if the p-value is smaller than .05 and to not reject but also not accept the null-hypothesis if the p-value is .05 or larger.

The result of the t-test is t(77) = 13.3, p < .001. Since the p-value is smaller than .05 we reject the null-hypothesis and we decide that the expected values are not equal. In other words, we decide that the population means are not equal. As we said above, this does not answer our research question, so we’d better move on to the estimation results.

The estimated difference between the expected values equals 3.84 kg, 95% CI [3.27, 4.42]. So, we estimate that the difference in expected weights after 10 weeks of following the diet is somewhere between 3.72 and 4.42 kilograms.

Cohen’s d for the paired design

Jamovi also provides point and interval estimates for Cohen’s d. This version of Cohen’s d is derived by standardizing the mean difference using the standard deviation of the difference scores. Figure 3 presents the relevant output. The estimated value of Cohen’s delta equals 1.51, 95% CI [1.18, 1.83]. Using rules of thumb for the interpretation of Cohen’s d, these results suggest that there may be a very large difference in mean weights of the pre- and postdiet measurements.

Figure 3. Estimation results from the paired t-test analysis in jamovi

There is an alternative conceptualisation of the standardized mean difference. Instead of using the SD of the difference scores, we may use the average of the SDs of the two measurements. See https://small-s.science/2020/12/cohens-d-for-paired-designs/ for an explanation and R-code for the calculation of the CI.

The independent t-test in jamovi

To answer the second research question, we will have to reframe the substantive question into a statistical one. Just like we assumed above, we will consider the difference between the expected values (or population means) to be the statistical quantity of interest.

The conventional statistical null-hypothesis of the t-test is that the expected value of the variable does not differ between the groups or conditions. In other words, the null-hypothesis is that the two population means are equal. If the test result is significant, we will reject the null-hypothesis and decide that the population means are not equal. Note that this does not really answer the research question. Indeed, we are interested in the extent to which the expected values differ and not in whether we can decide that the difference is not zero. For that reason, estimation results are usually more informative than the results of a significance test.

Doing the independent t-test in jamovi.

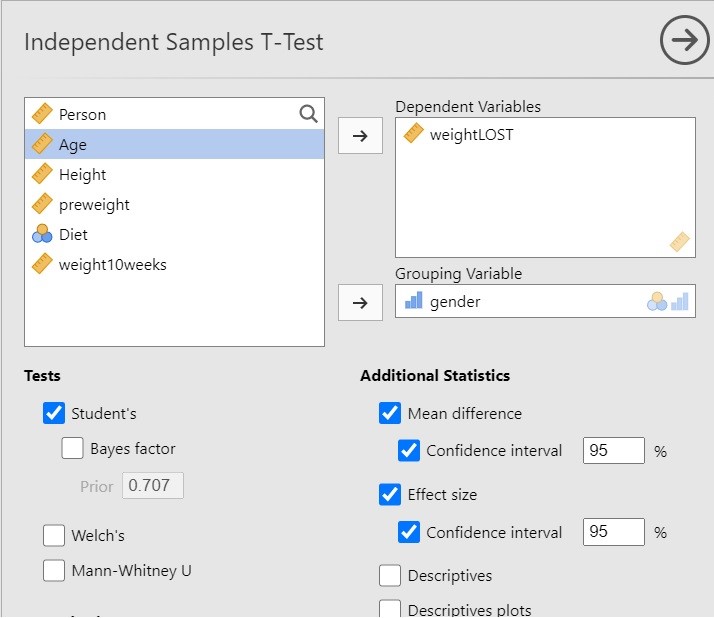
I have chosen the following options for the independent t-test analysis in jamovi.
Options for the independent t-test in jamovi.
Figure 4. Options for the independen t-test in jamovi

The above options will give you the results of the independent t-test and, more importantly, the estimation results, both unstandardized and standardized (Cohen’s d).

The independent t-test output

The relevant output is presented in Figure 5.

Output of the independent t-test analysis in jamovi. Including significance test and estimation results.
Figure 5. Output of the independent t-test analysis in jamovi

The result of the t-test is t(74) = -0.21, p = 0.84. This test result is clearly not significant, so we cannot decide that the population means differ. Importantly, we can also not decide that the population means are equal. That would be an instance of accepting the null-hypothesis and that is not allowed in NHST.

The estimation results (i.e. -0.12 kg, 95% CI [-1.29, 1.04]) make it clear that we should not necessarly believe that the population means are equal. Indeed, even though the estimated difference is only 0.12 kilograms, the CI shows the data to be consistent with differences up to 1 kg in either direction, i.e. with women showing more average weight loss than men or women showing less average weight loss than men.

Cohen’s d for the independent design

We can also find the standardized mean difference and its CI in the independent t-test output: Cohen’s d = -0.08, 95% CI [-0.50, 0.41]. In this case, Cohen’s d is based on the pooled standard deviaton. According to rules-of-thumb that are used frequently in psychology the estimated effect is negligible to small, but the CI shows the data to be consistent with medium effect sizes in either direction.

Chi-square test with summary data in jamovi

Suppose you want to do a chi-square test for independence in jamovi, but you only have summary data.  Fortunately it is super easy to do that in jamovi. Here is how.

This example is based on a question from an assignment I use in my Applied Statistics course (the assignment itself is from the instructor resources of the book Introduction to the New Statistics (first edition)).

The introductory text to the question is as follows.

To what extent might feeling powerful make you less considerate of the perspective of others?  In one study (Galinsky et al., 2006), participants were manipulated to feel either powerful (High  Power) or powerless (Low Power). They were then asked to write an ‘E’ on their forehead with a washable marker. Those who wrote the ‘E’ to be correctly readable from their own perspective—looking from inside the head—were considered ego-centric (Ego); those who
wrote it to be readable to others were considered to be non-ego-centric (Non-Ego).

Table 1 contains the data of the original study.

Ego Non-Ego Total
High Power 8 16 24
Low Power 4 29 33
Total 12 45 57
Table 1. Contingency table with the original data

Creating the dataset using summary data in jamovi

All you need to do is to a create a dataset with three variables. The first two variables are nominal variables. These variable define the rows and columns of your contingency table. Here, I opted for the variables Power, with levels 1 = High Power and 2 = Low Power and Perspective, with levels 1 = Ego and 2 = Non-Ego.

The third variable is the variable Counts (which can be nominal, ordinal and continuous, a far as I can tell). The count variable contains the number of observations for each combination of the two categorical variables.

This is what the dataset looks like:

Jamovi dataset with summary data for a chi-square test.
Figure 1. Jamovi dataset containing summary data for the chi-square test.

Doing the chi-square test

If you have the dataset, the rest is super easy as well. Just choose Frequencies on the Analyses tab followed by Independent samples. Now place your row, columns and counts variables in the right spot, as in Figure 2. That’s all!

Details of the chi-square test in jamovi.
Figure 2. input and output of the chi-square test using summary data in jamovi.

Comparing the quantiles of two groups

Comparing the quantiles of two groups provides information that is lost by simply looking at means or medians. This post shows how to do that.

Traditionally,  the comparison of two groups focuses on comparing means or medians.  But, as Wilcox (2012) explains, there are many more features of the distributions of two groups that we may compare in order to shed light on how the groups differ. An interesting approach is to estimate the difference between the quantiles of the two groups.  Wilcox (2012, pp. 138-150) shows us an approach that is based on the shift function. The procedure boils down to estimating the quantiles of both groups, and plotting the quantiles of the first group against the difference between the quantiles.

In order to aid in comparing the quantiles of the groups, I’ve created a function for R that can be used for plotting the comparison between the two groups. The functions uses the ggplot2 package and the WRS package (that can be found here: WRS: A package of R.R. Wilcox’ robust statistics functions version 0.24 from R-Forge (rdrr.io)) ; see also: Installation of WRS package (Wilcox’ Robust Statistics) | R-bloggers (r-bloggers.com).).

library(WRS)
library(ggplot2)

plotSband <- function(x, y, x.name = "Control") {
  x <- sort(x[!is.na(x)])
  y <- sort(y[!is.na(y)]) 
  qhat <- 1:length(x)/length(x)
  idx.y <- floor(qhat*length(y) + .5)
  idx.y[idx.y <= 0] <- 1
  idx.y[idx.y > length(y)] <- length(y)
  
  delta <- y[idx.y] - x
  
  cis <- WRS::sband(x, y, plotit=F)$m[, c(2, 3)]
  
  check.missing <- apply(cis, 2, function(x) sum(is.na(x)))
  if (sum(check.missing == length(x)) > 1) {
    stop("All CI limits equal to - or + Infinity")
  }
  ylims <- c(min(cis[!is.na(cis[,1]), 1]) - .50, 
             max(cis[!is.na(cis[,2]), 2]) + .50)
  
  cis[is.na(cis[, 1]), 1] <- ylims[1]*5
  cis[is.na(cis[, 2]), 2] <- ylims[2]*5
  
  thePlot <- ggplot(mapping = aes(x)) + 
    xlab(x.name) + 
    geom_smooth(aes(x = x, y = delta), se = F, col="blue") + 
    ylab("Delta") +
    geom_point(aes(x = quantile(x, c(.25, .50, .75)), 
                   y = rep(ylims[1], 3)), pch=c(3, 2, 3), size=2) +
    geom_ribbon(aes(ymin = cis[,1], ymax = cis[,2]), alpha=.20) + 
    coord_cartesian(ylim = ylims)
  suppressMessages(print(thePlot))
}

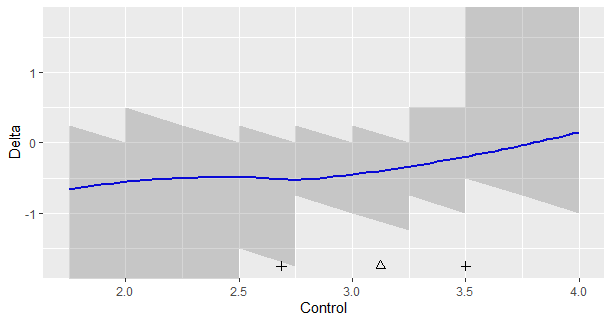
Let’s look at an example. Figure 1 presents data from an experiment investigating the persuasive effect of narratives on intentions of adopting a healthy lifestyle (see for details Boeijinga, Hoeken, and Sanders (2017)). The plotted data are the differences in intention between the quantiles of a group of participants who read a narrative focusing on risk-perception (detailing the risks of unhealthy behavior) and a group of participants who read a narrative focusing on action-planning (here called the control group), focusing on how the healthy behavior may actually be implemented by the participant.

Comparing the quantiles of two groups
Figure 1. Output from the plotSband-function

Figure 1 shows the following. The triangle is the median of the data in the control group, and the plusses the .25th and .75th quantiles. The shaded regions define the simultaneous 95% confidence intervals for the differences between the quantiles of the two groups. Here, these regions appear quite ragged, because of the discrete nature of the data. For values below 2.5 and above 3.5, the limits (respectively the lower and upper limits of the 95% CI’S) equal infinity, so these values extend beyond the limits of the y-axis. (The sband function returns NA for these limits). The smoothed-regression line should help interpret the general trend.

How can we interpret Figure 1? First of all, if you think that it is important to look at statistical significance, note that none of the 95% intervals exclude zero, so none of the differences reach the traditional significance at the .05 level. As we can see, none of them exclude differences as large as -0.50 as well, so we should not be tempted to conclude that because zero is in the interval that we should adopt zero as the point-estimate. For instance, if we look at x = 2.5, we see that the 95% CI equlas [-1.5, 0.0], the value zero is included interval, but so is the value -1.5. It would be unlogical to conclude that zero is our best estimate if so many values are included in the interval.

The loess-regression line suggests that the differences in quantiles between the two groups of the narrative is relatively steady for the lower quantiles of the distribution (up to the x = 3.0, or so; or at least below the median), but for quantiles larger than the median the effect gets smaller and smaller until the regression line crosses zero at the value x = 3.75. This value is approximately the .88 quantile of the distribution of the scores in the control condition (this is not shown in the graph).

The values on the y-axis are the differences between the quantiles. A negative delta means that the quantile of the control condition has a larger value than the corresponding quantile in the experimental condition. The results therefore suggest that participants in the control condition with a relatively low intention score, would have scored even lower in the other condition. To give some perspective: expressed in the number of standard deviations of the intention scores in the control group a delta of -0.50 corresponds to a 0.8 SD difference.

Note however, that due to the limited number of observations in the experiment, the uncertainty about the direction of the effect is very large, especially in the tails of the distribution (roughly below the .25 and above the .75 quantile). So, even though the data suggest that Action Planning leads to more positive intentions, especially for the lower quantiles, but still considerably for the .75 quantile, a (much) larger dataset is needed to obtain more convincing evidence for this pattern.

A confidence interval for the correlation coefficient

A confidence interval for the  population correlation coefficient \rho can be obtained with the Fisher-r-to-z transformation.   The steps are as follows.

  1. Transform r to a standard normal deviate Z
    Z_{xy} = \frac{1}{2}ln\left(\frac{1 + r}{1  –  r}\right), \tag{1}
    which is equal to:
    Z_{xy} = arctanh(r). \tag{2}
  2. Determine the standard error for Z:
    s_Z = \sqrt\frac{1}{N  –  3}. \tag{3}
  3. Calculate the Margin of Error (MoE) for Z:
    MOE_Z = 1.96*s_z. \tag{4}
  4. Add to and substract MoE  from Z to obtain a 95% Confidence Interval for Z.
  5. Transform the upper and lower limits of the CI for Z to obtain the corresponding limits for \rho, using:
    r_Z = \frac{e^{2Z} –  1}{e^{2Z} + 1}, \tag{4}
    which is equal to:
    r_Z = tanh(Z). \tag{5}

The following R-code does all the work:

conf.int.rho <- function(r, N) {
lims.rho =  tanh(atanh(r) + c(qnorm(.025), 
			qnorm(.975)) * sqrt(1/(N - 3)))
return(lims.rho)
}

So, if you have r = .50 and N = .50, just run the above function in R to obtain a confidence interval for the correlation coefficient. 

conf.int.rho(.50, 50)

## [1] 0.2574879 0.6832563


Cohen’s d for paired designs

For the paired design, which is traditionally used to obtain data for the paired t-test, we can calculate a standardized mean difference, Cohen’s d, using the average of the standard deviations of the two conditions. Cohen’s d for paired designs can be calculated as follows.

d_{av} =\frac{(M_1 - M_2)}{s_{av}}, \tag{1}

where s_{av} equals

s_{av}= \sqrt{\frac{1}{2}(S^2_1+S^2_2)}. \tag{2}

Now, (1) is of course an estimate of (3), the population value of Cohen’s d for paired designs, but we do not only need a point estimate, but also a confidence interval.

The following R-code can be used to obtain a 95% confidence interval for the estimate of \delta_{av}, the population mean difference standardized by using the average of the two standard deviations:

\delta_{av} = \frac{\mu_1 - \mu_2}{\sqrt{\frac{1}{2}(\sigma_1^2 + \sigma_2^2)}} , \tag{3}

This procedure uses the approximate procedure by Algina & Keselman (2003), which is also used by ESCI (Cumming, 2012; Cumming and Calin-Jageman, 2017), as Kline (2013) explains. The following steps are performed to obtain the 95% confidence interval.

  1. Use the obtained t-value of the paired t-test to estimate the non-centrality parameter \lambda. Steps 2 and 3 are for calculating a 95% confidence interval for the non-centrality parameter.
  2. Use an iterative procedure to find the non-centrality parameter of the t-distribution for which the observed t-value is the .025 quantile. This is the upper limit of the confidence interval for the non-centrality parameter.
  3. Use an iterative procedure to find the non-centrality parameter of the t-distribution for which the observed t-value is the .975 quantile. This is the lower limit of the confidence interval for the non-centrality parameter.
  4. To obtain a CI for \delta_{av} multiply the limits of the confidence interval for the non-centrality parameter by the value \sqrt{\frac{2S_D^2}{n(S_1^2+S_2^2)}} where n is the sample size, S_D^2 the variance of the difference scores , and S_1^2 and S_2^2 the variances of the two variables.

The following R-function does all the work. Note that with large potential values for the noncentrality parameter R issues warnings that “full precision has not been achieved in ‘pnt{final}'”. These warnings can be ignored ( I checked many examples against ESCI’s output), but in order to prevent them, I let the optimize function search from the observed value of t to maximally five times its value, and I have included the option to suppress warnings or not (just set warn = TRUE to get the warnings).

ci.d.av <- function(t, n, s.1, s.2, s.diff, warn = FALSE) {
  if (t < 1) {
    lims <- c(-5, 5)
  } else {
    lims <- c(-5*abs(t), 5*abs(t))
  }
  df = n - 1
  multiplier = sqrt((2*s.diff^2) / (n*(s.1^2 +  s.2^2)) )
  loss <- function(x, prob) (pt(t, df, x) - prob)^2  
  if (warn == FALSE) {
    ul <- suppressWarnings(optimize(loss, lims, prob=.025))$minimum 
    ll <- suppressWarnings(optimize(loss, lims, prob=.975))$minimum
  } else {
    ul <- optimize(loss, lims, prob=.025)$minimum 
    ll <- optimize(loss, lims, prob=.975)$minimum
  } 
    return(round(c(ll, ul), 4)*multiplier)  
}

The arguments of the function are t, the t-value of the t-test testing the hypothesis of equal population means, the sample size (n), the standard deviations (s.1 and s.2) of the two variables and the standard deviation of the difference scores (s.diff).

Calculating Cohen’s d for paired designs: an example

Here is a quick example.

library(MASS)
set.seed(1234)

# generate random multivariate normal data with sample size n = 20

theData <- mvrnorm(20, c(.5, .0), matrix(c(1, .8, .8, 1), 2, 2))

# calculate the standard deviations 

sds <- apply(theData, 2, sd)

# calculate the standard deviation of difference scores 

sDiff <- sd(theData[,1] - theData[,2])

# get t.value and a value for d.av 
# here I use the output of the t-test in R to obtain t and the mean
# difference score (needed for calculating d.av)

theTest <- t.test(theData[,1], theData[,2], paired=TRUE)
t = theTest$statistic
d.av = theTest$estimate / mean(sds)

ci.d.av(t = t, n = 20, s.1 = sds[1], s.2 = sds[2], sDiff)

The results are that the estimate equals d_{av} = 0.87, 95\% \text{CI} [0.51, 1.22].

Alternatively, we can make use of the conf.limits.nct function of the MBESS package (Kelley, 2007a, 2007b), and proceed as follows (using the data generated above).

library(MBESS)

ci.d.av.2 <- function(t, n, s.1, s.2, s.diff) {
  df = n - 1
  multiplier = sqrt((2*s.diff^2) / (n*(s.1^2 +  s.2^2)) )
  unlist(conf.limits.nct(t, df)[c(1,3)])*multiplier
}

ci.d.av.2(t = t, n = 20, s.1 = sds[1], s.2 = sds[2], s.diff = sDiff). 

References

Algina, J. & Keselman, H. J. (2003). Approximate confidence intervals for effect sizes. Educational and Psychological Measurement, 63, 721-734.

Cumming, G. (2012). Understanding the New Statistics. Effect Sizes, Confidence Interval, and Meta-Analysis. New York: Routledge.

Cumming, G. & Calin-Jageman, R. (2017). Introduction fo the New Statistics. Estimation, Open Science, and Beyond. New York: Routledge.

Kelley, K. (2007b). Confidence intervals for standardized effect sizes: Theory, application, and implementation. Journal of Statistical Software20(8), 1-24.

Kelley, K. (2007a). Methods for the Behavioral, Educational, and Social Sciences: An R Package. Behavior Research Methods39, 979–984.

Kline, R.b. (2013). Beyond Significance Testing. Statistics Reform in the Behavioral Sciences. (Second Edition). Washington: APA.

Custom contrasts for the one-way repeated measures design using Lmer

Here is some code for doing one-way repeated measures analysis with lme4 and custom contrasts. We will use a repeated measures design with three conditions of the factor Treat and 20 participants. The contrasts are Helmert contrasts, but they differ from the built-in Helmert contrasts in that the sum of the absolute values of the contrasts weights equals 2 for each contrast.
The standard error of each contrast equals the square root of the product of the sum of the squared contrast weight w and the residual variance divided by the number of participants n.

    \[\sigma_{\hat{\psi}} =  \sqrt{\sum{w_i}\sigma^2_e/n}\]

The residual variance equals the within treatment variance times 1 minus the correlation between conditions. (Which equals the within treatment variance minus 1 times the covariance \rho\sigma^2_{within}) .

    \[\sigma^2_e = \sigma^2_{within}(1 - \rho)\]

In the example below, the within treatment variance equals 1 and the covariance 0.5 (so the value of the correlation is .50 as well). The residual variance is therefore equal to .50.

For the first contrasts, the weights are equal to {-1, 1, 0}, so the value of the standard error of the contrasts should be equal to the square root of 2*.50/20 = 0.2236.

library(MASS)
library(lme4)
# setting up treatment and participants factors
nTreat = 3
nPP = 20
Treat <- factor(rep(1:nTreat, each=nPP))
PP <- factor(rep(1:nPP, nTreat))

# generate some random 
# specify means

means = c(0, .20, .50)

# create variance-covariance matrix
# var = 1, cov = .5
Sigma = matrix(rep(.5, 9), 3, 3)
diag(Sigma) <- 1

# generate the data; using empirical = TRUE
# so that variance and covariance are known
# set to FALSE for "real" random data

sco = as.vector(mvrnorm(nPP, means, Sigma, empirical = TRUE))

#setting up custom contrasts for Treatment factor 
myContrasts <- rbind(c(-1, 1, 0), c(-.5, -.5, 1))
contrasts(Treat) <- ginv(myContrasts)

#fit linear mixed effects model: 
myModel <- lmer(sco ~ Treat + (1|PP))

summary(myModel)
## Linear mixed model fit by REML ['lmerMod']
## Formula: sco ~ Treat + (1 | PP)
## 
## REML criterion at convergence: 157.6
## 
## Scaled residuals: 
##     Min      1Q  Median      3Q     Max 
## -2.6676 -0.4869  0.1056  0.6053  1.9529 
## 
## Random effects:
##  Groups   Name        Variance Std.Dev.
##  PP       (Intercept) 0.5      0.7071  
##  Residual             0.5      0.7071  
## Number of obs: 60, groups:  PP, 20
## 
## Fixed effects:
##             Estimate Std. Error t value
## (Intercept)   0.2333     0.1826   1.278
## Treat1        0.2000     0.2236   0.894
## Treat2        0.4000     0.1936   2.066
## 
## Correlation of Fixed Effects:
##        (Intr) Treat1
## Treat1 0.000        
## Treat2 0.000  0.000

Distribution of the difference between two binomial variables

For a project I’m working on, I needed to work with the probabilities associated with the difference between two binomial variables. I thought I’d share the code for four functions for calculating the probability mass and the cumulative probabilites.

The functions d.diff.binom (probability mass) and p.diff.binom (cumulative distribution) are functions for calculating the distribution of the differences for equal sample sizes N and equal “succes” probability.  The arguments of the functions are the quantiles k of the distribution of the differences, the number of trials N and the probability of succes p. 

The functions d.diff.binom.un (probability mass) and p.diff.binom.un (cumulative distribution) are functions for calculating the distribution of the differences for sample sizes and succes probabilities that may (or may not) differ between the two populations. The arguments of the functions are the quantiles k of the distribution of the differences, the number of trials N.1 and N.2 for the two groups and the probability of succes p.1 and p.2 for each group. 


#equal N and p:
#probability mass:
d.diff.bin = function(k, N, p) {
diff = outer(0:N, 0:N, "-")
prob = outer(dbinom(0:N, N, p, log=TRUE),
dbinom(0:N, N, p, log=TRUE), "+")
p = sum(exp(prob))
return(p)
}
#cumulative probability:
p.diff.bin = function(k, N, p) {
diff = outer(0:N, 0:N, "-")
prob = outer(dbinom(0:N, N, p, log=TRUE),
dbinom(0:N, N, p, log=TRUE), "+")
p = sum(exp(prob))
return(p)
}
#examples
d.diff.bin(0, 30, .50)
## [1] 0.1025782
p.diff.bin(0, 30, .50)
## [1] 0.5512891
#mean of distribution:
N = 30
m = sum(sapply(-N:N, d.diff.bin, N = 30, p= .50)*(-N:N))
m
## [1] -3.084642e-20
all.equal(0, m)
## [1] TRUE
#(un)equal N and p:
#probability mass:
d.diff.bin.un = function(k, N.1, N.2, p.1, p.2) {
diff = outer(0:N.1, 0:N.2, "-")
prob = outer(dbinom(0:N.1, N.1, p.1, log=TRUE),
dbinom(0:N.2, N.2, p.2, log=TRUE), "+")
p = sum(exp(prob))
return(p)
}

#cumulative distribion: 
p.diff.bin.un = function(k, N.1, N.2, p.1, p.2) {
diff = outer(0:N.1, 0:N.2, "-")
prob = outer(dbinom(0:N.1, N.1, p.1, log=TRUE),
        dbinom(0:N.2, N.2, p.2, log=TRUE), "+")
p = sum(exp(prob))
return(p)
}

#examples
d.diff.bin.un(0, 30, 20, .60, .70)
## [1] 0.05896135
p.diff.bin.un(0, 30, 20, .60, .70)
## [1] 0.1497043

A rule of thumb for setting target MOE

One of the most difficult aspects of sample size planning for precision is the specification of a target Margin of Error (MoE). Here, I would like to introduce a simple rule of thumb, in the hope that it helps you in determining a reasonable target MoE.
Here, the rule of thumb is applied to obtaining an estimate of the difference between two independent group means, where the two populations are normally distributed with equal variances.

Goal 1: Assessing the direction of an effect

Sample size planning starts with formulating a goal for the research. A very common goal is to try to determine the direction of an effect. For the goal of assessing the direction of an effect, it helps if the confidence interval of the difference contains only positive or negative values. That is, you want a confidence interval that exludes the value 0, for if that value is included, you would probably conclude that the estimate is consistent with both positive and negative effects. Thus, our first goal is to obtain a confidence interval of the mean difference that excludes the value 0.

Now, a confidence interval excludes 0, if obtained MOE is at most equal to the obtained effect size estimate. Suppose that the estimate equals the true effect of say, 0.50, we want MOE to be at most very close to 0.50, otherwise 0 will be included in the interval. But if our estimate underestimates the true effect, say the estimate equals 0.30, we want MOE to be at most very close to 0.30. Likewise, if we overestimate the effect, MOE can be larger than 0.50.

This means that we cannot say, for instance, we expect that the true effect is .50, so let’s plan for a target MOE that with 80% assurance is at most .50, because this target MOE may be too large for underestimates of the true effect, depending on the extent to which the effect is underestimated. So, in specifying target MOE, we should take into account that underestimates of the effect size occur. (Actually, these underestimates occur with a relative frequency of 50% in a huge collection of direct replications). We can say that we do not only want to exclude zero from the interval, but also that we want that to occur in a large proportion of direct replications. This will be our second goal. I will call the probabiity associated with our second goal, the probability of exclusion (PE)

The rule of thumb is that if we want 80% probability that a random confidence interval excludes zero, we should plan for an expected MOE equal to f = d / √2. (the square root sign is unreadable in my browser; so in words: the effect size divided by the square root of 2; with mathjax: $f = d / sqrt{2}$). Since there is 50% probability that obtained MOE will be larger than expected MOE, this is equal to planning for target MOE = f = d / √2, with 50% assurance or simply without assurance. You can do this in the ESCI-software, but also with the R-functions provided below.

The first example in the code below, is an illustration of planning for assessing the direction of the effect, with true effect size d = .50. If we want 80% assurance to have only positive values in our confidence interval, we should plan for a target MoE = expected MoE = f = d / √2 = 0.3535. Using the SampleSize-function below, this gives a sample size n = 63, or total sample size = N = 2*63 = 126. The probability that the confidence interval excludes 0 equals approximately 80% (p = 0.7951). So, the rule of thumb of planning for d / √2, seems to work pretty good.

Goal 2: distinguishing between effect sizes

If your research goal is to estimate the value of the effect size in stead of its direction, the rule of thumb can be used as follows. Suppose we do not know the true effect size, but want to have 80% assurance that we have a high probability to be able to distinguish between small (d = .20) and large effects (d = .80). That is, if the true effect is .20 we want the value .80 to be excluded from the confidence interval and if the true effect is .80, we want the value .20 to be excluded from the confidence interval.

We can proceed as follows, the difference between the effect sizes is .80 – .20 = .60. We use this value to determine target MOE. Thus, if we now plan for a target MoE = expected Moe = d / √2), we should have approximately 80% PE that obtained MoE will exclude 0.80 if the true effect is 0.20 and vice versa. The functions below give sample size n = 44, and the probablity of exclusion equals .7947. So, our rule of thumb, seems to work pretty good again. See example 2 in the code below.

Alternatively, we could take the region of practical equivalence (ROPE) into account. Suppose, our equivalence range equals .10 sigma. If we want to have enough precision to distinguish large from small effects, we should plan as follows. We take the difference between a large effect and the upper equivalence value of a small effect or, equivalently, the difference between a small effect and the lower equivalence vaue of a large effect, i.e. .50, and plan for f = .50 / √2. If the effect is large we expect a confidence interval that excludes the equivalence range for the small effect (and vice versa), with 80% probability of exclusion.

But we could also take the difference between the lower equivalence value of a large effect and the upper equivalence value of a small effect, i.e. .40, and plan for f = .40/√2. (See the third example in the code below) This will give us 80% PE that any true value within the ROPE of the one effect will exclude values in the ROPE of the other. For example, if the true effect is .70, and expected MOE equals .40/√2 = .2828, there is approximately 80% probability that the 95% CI excludes .30, which is in the ROPE of a small effect. The expected CI will be .70 +/- .2828 = [0.4172, 0.9828]. Note that the lower limit is larger than the upper limit of the ROPE for d = .20, as we want it to be. Note, however, that if the true effect is small (d = .20), the CI will exclude effects equivalent to large effects, which is consistent with our research goal, but it will not exlude the value 0 or effects equivalent to a medium effect. Indeed, the expected CI will be [-0.0828, 0.4828]. (This is not a problem, of course, since this was not the purpose of our research)

As a final example, suppose we want sufficient precision to distinguish small from medium effects (or large from medium effects). If we take the ROPE perspective, with an equivalence range of +/- .10 sigma, the lower equivalence value of the medium effect equals .50 – .10 = .40 and the upper limit of the small effect equals .30. If we want 80% assurance that the CI will be small enough to distinguish small from medium effects, we should plan for expected MOE f = (.40 – .30)/√2 = 0.0707. Using the functions below, this requires a sample size n = 1538. (See the final example in the code below).

Setting target MOE: conclusion

In summary, the rule of thumb is to divide the effect size d by √2 and plan for an expected MoE equal to this value. This will give you a sample size that gives approximately 80% assurance that the CI will not contain 0. In the case of distinguishing effect sizes, one option is to divide the difference between the lower equivalence value of the larger effect and the upper equivalence value of the smaller effect by the square root of 2 and plan for an expected MoE equal to this value. This will give you a sample size that gives approximately 80% PE that the CI of the estimated true value of one effect excludes the values in the ROPE of the other effect.

Do you want at least 90% PE? Use the square root of three, in stead of the square root of two, in determining target MoE.

eMoe = function(n) {
eMoe = qt(.975, 2*(n - 1))*sqrt(2/n)
return(eMoe)
}

cost <- function(n, tMoe) {
(eMoe(n) - tMoe)^2
}

sampleSize <- function(tMoe) {
optimize(cost, interval=c(10, 5000), tMoe = tMoe)$minimum
}

# FIRST EXAMPLE
# plan for 80% assurance of excluding 0
# i.e. estimate the direction if true effect
# equals .50 

d = .50

#application of rule of thumb:
f = .50 / sqrt(2)

#sampleSize (uses ceiling() to round up): 
n = ceiling(sampleSize(f))
n
## [1] 63
# Probabiity of Exclusion (here taken to be equivalent to
# power for two-sided t-test (since true direction is unknown))
df = 2*(n - 1)
ncp = f / sqrt(1/n) #or ncp = d / sqrt(2/n)

pt(qt(.025, df), df, ncp) + 1 - pt(qt(.975, df), df, ncp)
## [1] 0.7951683
# SECOND EXAMPLE: 
# distinguish between small and large effect sizes: 
d = .80 - .20
f = d / sqrt(2)

n = ceiling(sampleSize(f))
n
## [1] 44
df = 2*(n - 1)
ncp = f / sqrt(1/n) #or ncp = d / sqrt(2/n)

#PE: 

pt(qt(.025, df), df, ncp) + 1 - pt(qt(.975, df), df, ncp)
## [1] 0.79467
# EXAMPLE 3: distinguish small and large with ROPE
# ROPE small and large: 
rope.small = c(.10, .30)
rope.large = c(.70, .90)

d = rope.large[1] - rope.small[2]
f = d / sqrt(2)

n = ceiling(sampleSize(f))

n
## [1] 98
df = 2*(n - 1)
ncp = f / sqrt(1/n) #or ncp = d / sqrt(2/n)

#PE: 

pt(qt(.025, df), df, ncp) + 1 - pt(qt(.975, df), df, ncp)
## [1] 0.7956414
# Example 4: distinguish medium from small 
# or medium from large with ROPE

rope.medium = c(.40, .60)
d = rope.medium[1] - rope.small[2]
f = d / sqrt(2)

n = ceiling(sampleSize(f))

n
## [1] 1538
df = 2*(n - 1)
ncp = f / sqrt(1/n) #or ncp = d / sqrt(2/n)

#PE:

pt(qt(.025, df), df, ncp) + 1 - pt(qt(.975, df), df, ncp)
## [1] 0.7916783

The omnibus F-test may be ignored if you use multiple comparison procedures

I think  trying to be scientific with a small s involves asking critical questions about  common wisdom or common practice. In this post, I would like to focus on multiple comparisons in the context of ANOVA. What does common practice indicate?

Common wisdom suggests doing multiple comparisons only if the F-test is significant

Let’s have a look on some practical advice considering multiple comparisons found on the web (R-bloggers.com) and in Field (2015).

“One way to begin an ANOVA is to run a general omnibus test. The advantage to starting here is that if the omnibus test comes up insignificant, you can stop your analysis and deem all pairwise comparisons insignificant. If the omnibus test is significant, you should continue with pairwise comparisons” (https://www.r-bloggers.com/r-tutorial-series-one-way-anova-with-pairwise-comparisons/)

“When we have a statistically significant effect in ANOVA and an independent variable of more than two levels, we typically want to make follow-up comparisons. There are numerous methods for making pairwise comparisons and this tutorial will demonstrate how to execute several different techniques in R.” (https://www.r-bloggers.com/r-tutorial-series-anova-pairwise-comparison-methods/)
And have a look at how the text book I used to use in my statistics course explains it.

“It might seem a bit unhelpful that an ANOVA doesn’t tell you which groups are different from which, given that having gone to the trouble of running an experiment, you probably need to know more than ‘there’s some difference somewhere or other’. You might wonder, therefore, why we don’t just carry out a lot of t-tests, which would tell us very specifically whether pairs of group means differ. Actually, the reason has already been explained in Section 2.1.6.7: every time you run multiple tests on the same data you inflate the potential Type I errors that you make. However, we’ll return to this point in Section 11.5 when we look at how we follow up an ANOVA to discover where the group difference lie.” (Field, 2015, p. 442).
Although, in honesty, on p. 459 Field writes:

“The least significance difference (LSD) pairwise comparison makes no attempt to control Type I error and is equivalent to performing multiple t-tests on the data. The only difference is that LSD requires the overall ANOVA to be significant.”

This is meant to inform about the relative merits of one post hoc procedure to another in terms of Type I and Type II error.  Crucially, it is not mentioned that the other post-hoc procedures require that the overall ANOVA be significant. (As common wisdom seems to suggest). However,  his flow-chart of the ANOVA procedure (p. 460) clearly suggests multiple comparison procedures should be used as post-hoc procedures (after the ANOVA is significant).

Thus, common “statistical” wisdom seem to suggest that multiple comparison procedures are to be used as post hoc procedures following up a significant omnibus F-test. And the reason is that this two-stepped procedure minimizes the probability of type I errors.

Now, let’s ask ourselves whether this common sense is, well, sensible.

Multiple comparisons only after significant F-test affects power negatively

Wilcox (2017) contains some useful information regarding our question. In his discussion of the much used Tukey-HSD procedure (the Tukey-Kramer Method), he references Bernhardson, (1975) who shows that the probability of at least 1 type I error among pairwise comparisons of estimates of equal population means (i.e. true null-hypotheses) is no longer equal to \alpha if the procedure is only carried out following a significant omnibus test. That is, if we use our beloved two step procedure.

The consequence of the two step procedure for the Tukey-HSD is that \alpha is reduced. Thus, if we want our multiple comparisons procedure to generate one type I error or more at most with a probability of  \alpha = .05, using the 2 step procedure leads to a lowered \alpha. This is of course, bad news, because in the event that not all of the null-hypotheses are true, lowering \alpha increases \beta, the probability of not rejecting when the null-hypothesis is false (keeping the sample size constant, of course). In other words, the two step procedure decreases the power of the multiple comparison procedure.

In the words of Wilcox (2017):

“In practical terms, when it comes to controlling the probability of at least one type I error, there is no need to first reject with the ANOVA F test to justify using the Tukey-Kramer method. If the Tukey-Kramer method is used only after the F test rejects, power can be reduced. Currently, however, common practice is to use the Tukey-Kramer method only if the F-test rejects. That is, the insight reported by Bernhardson is not yet well known.”  (p. 385).

In conceptual terms,  the fact that the probability of at least one type I error in the multiple comparison procedure is  smaller than \alpha if the F-test rejects is pretty clear, at least to me it is. Suppose we reject if the p-value of the F-test is smaller or equal to 5%. This will also be the probability that we conduct the multiple comparison test over repeated replications of the same experiment. Of that 5%, not every application of the procedure will result in at least one type I error. Indeed, a puzzling fact for many beginning researchers is that the F-test is significant while none of the pairwise comparisons is. In other words, some of those 5%  of the cases in which we perform the procedure following a significant F-test will probably not reject any of the pairwise null-hypotheses, unless it is guaranteed that at least one type I error per application will be made.

(With no adjustment of \alpha for multiple comparisons, this will happen (with high probability so no guarantee) if a huge number of pairwise comparisons are made. For instance, with 99 unadjusted multiple comparisons the probability of at least one type I error is 99%.; this is why it makes sense to demand that the F-test is significant before testing multiple comparisons with the LSD procedure. Although the latter seems to run into trouble with more than 3 groups (Wilcox, 2017).

A quick simulation study

My hunch is that the two-step procedure is unnecessary for the Tukey-Kramer method as well as for other multiple comparison procedures (the exception Fisher’s LSD procedure which was designed as a post hoc procedure to be used as a follow up after a significant F-test, as Field (2015) rightly points out), but I only focused on the Tukey-Kramer method. What I did was a simple simulation study with a four group between subjects design (all \mu‘s equal) and estimated the probability of at least type I error both with and without using the 2 step procedure.

set.seed(456)
#number of groups
ngr = 4

#number of participants
n = 40

#group is a factor
gr <- factor(rep(1:ngr, each=n))

#vector for storing rejections F-test
Reject <- rep(0, 10000)

#vector for storing #rejections multiple
#comparisons
RejectHSD <- rep(0, 10000)

for (i in 1:10000) {

y = rnorm(ngr*n)
mod = aov(y ~ gr)
Reject[i] = anova(mod)$"Pr(>F)"[1] <= .05
PS <- TukeyHSD(mod)$gr[,4]
RejectHSD[i] = sum(PS <=.05)
}

#probability type I error F-test
sum(Reject)/length(Reject)
## [1] 0.0515
#probability at least one type I error Tukey HSD
sum(RejectHSD > 0) / length(RejectHSD)
## [1] 0.0503
#probability at least one type I error given F-tests Rejects
sum(RejectHSD[Reject==TRUE] > 0) / length(RejectHSD)
## [1] 0.0424

Even though a single (relatively tiny) simulation (which, by the way, takes a long time to run, nonetheless), is not necessarily convincing, it does  illustrate the main points of this post. First, the probability of at least one incorrect rejection using the TukeyHSD function is close to .05. With this particular random seed it even performs a little better than the ANOVA F-test: .0503 versus .0515. This illustrates that even without considering whether the omnibus test is significant the main demand of not rejecting too many true null-hypotheses is completely satisfied. So, in practical terms, you can safely ignore the omnibus test if your concerns are about  \alpha.

Second, the probability of incorrectly rejecting at least one true pair-wise null-hypothesis after the ANOVA F-test is significant is estimated to be .0424. This shows, that the two-step procedure leads to a larger decrease in the actual type I error probability than is wanted. Even though this may seem good news from the perspective of avoiding type I errors, the down side is that pair wise null-hypotheses that are false (and potentially important) may not be detected.

Conclusion

Common wisdom and practice suggest that multiple comparisons procedures should be done only after a significant omnibus test. We have seen that this is not at all necessary if we use a multiple comparisons procedure that is designed to control the type I error probability. To my knowledge, most of the procedures conventionally thought of as post hoc tests are designed in this manner, the exception being the LSD procedure which does require a significant F-test. For practical purposes, then, do not bother with the omnibus test (note the exception) if you are planning to pair wise compare all the treatment means.
This practical advice does not mean, of course, that I am suggesting you spend your time comparing all treatment means. Most of the time, focused comparisons are a more fruitful way of analysing your data. But I’ll leave that topic for another time.

References

Field, A. (2013). Discovering Statistics Using IBM SPSS Statistics. 4th Edition. London: Sage.
Wilcox, R. (2017). Understanding and Applying Basic Statistical Methods Using R. Hoboken, NJ: Wiley,